Scope of the
India Spotlight
2020
This second edition of the India Index seeks to continue driving and tracking nutrition contributions of the largest food and beverage manufacturers’ in India by providing relevant stakeholders with a tool that:
i) tracks the commitments and practices of food and beverage manufacturers to addressing the double burden of malnutrition;
ii) can be used to hold rated companies to account for delivering on their commitments to tackle these important challenges in the context of national and international nutrition agendas.
Thematic scope
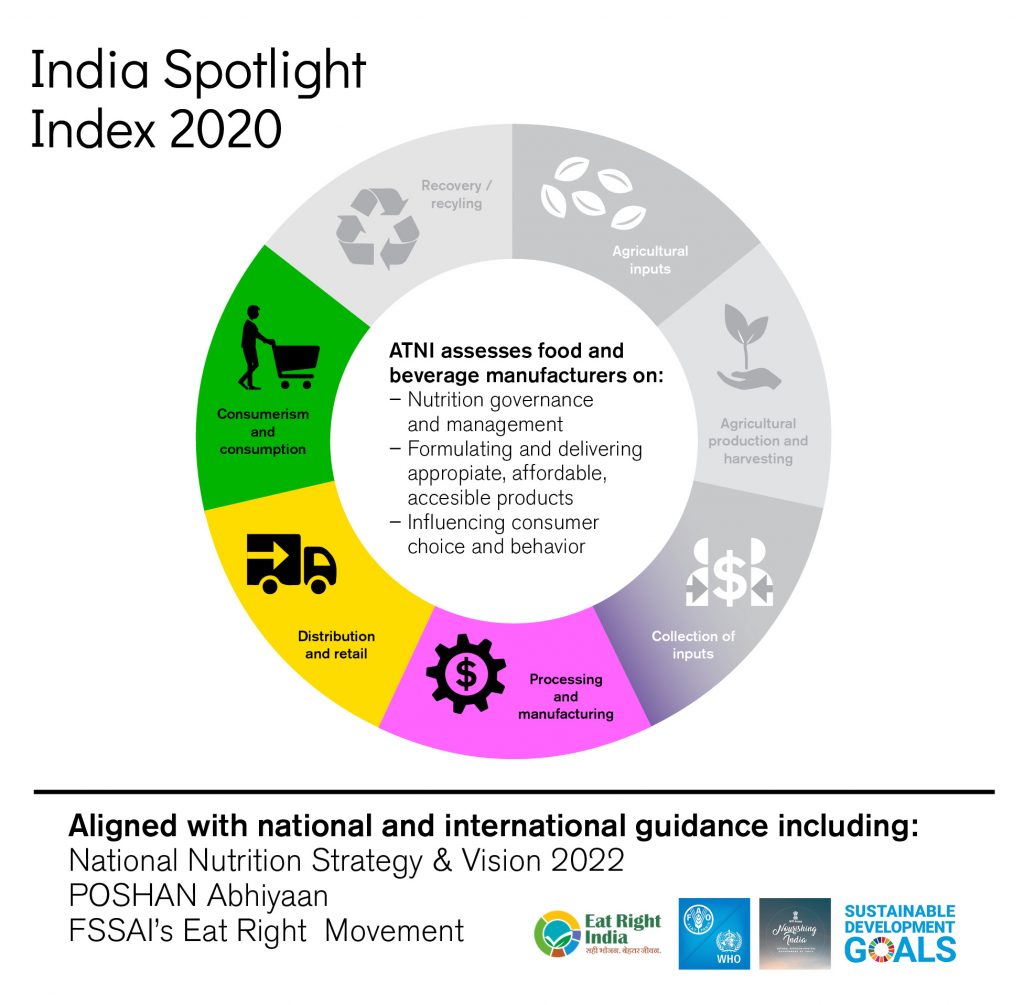
The food and nutrition value chain is complex and varied, including a range of actors from farmers and agricultural companies, to manufacturers, retailers, restaurants and food service companies. Although ATNI recognizes all levels and value chain actors are necessary for delivering healthy and sustainable foods and diets, the India Index focuses on the food and beverage manufacturers that produce packaged food and beverages in India.
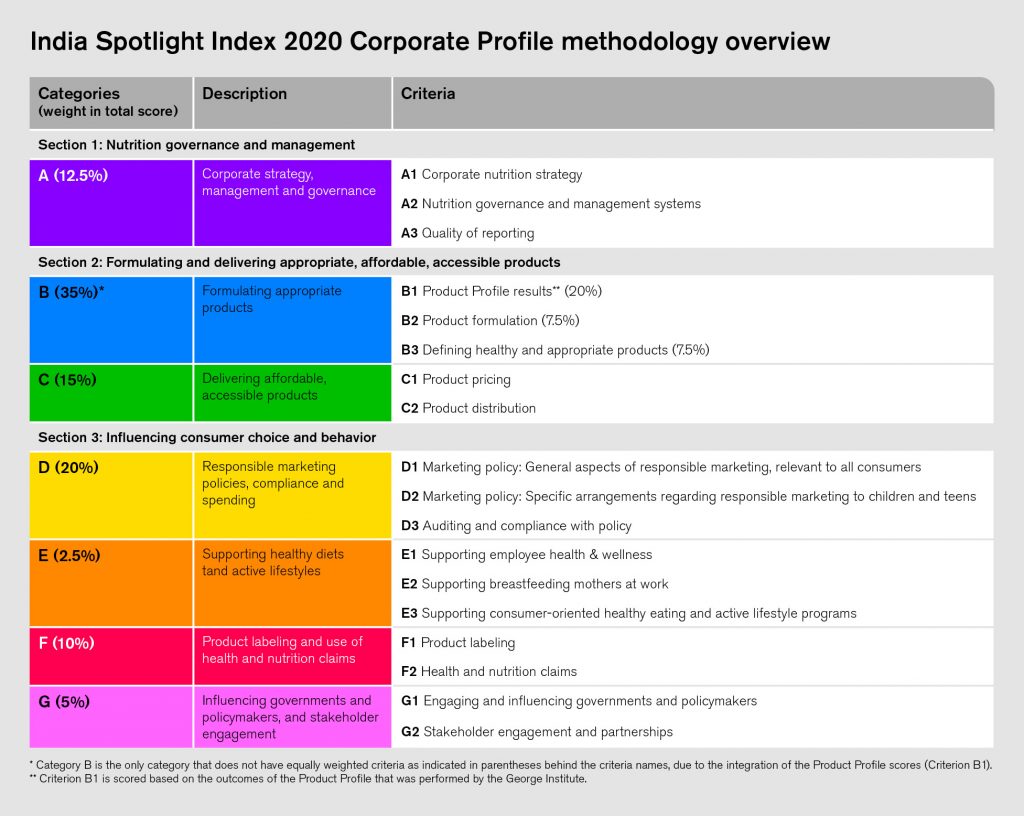
The Index assesses and ranks companies based on their commitments, performance and disclosure practices in seven topic areas (Categories A – Governance, B – Products, C – Accessibility, D – Marketing, E – Lifestyles, F – Labeling, G – Engagement) that together cover three broad sections: i. nutrition governance and management; ii. formulating and delivering appropriate, affordable and accessible products; and, iii. influencing consumer choice and behavior. Importantly, in addition to tracking companies’ contributions to the Sustainable Development Goals, the India Index 2020 methodology has been adapted to cover the most recent developments in the Indian nutrition context, as shown below.
ATNI Indexes have previously included an assessment of the marketing practices of major baby food companies, which are presented as the Breast-milk Substitutes (BMS) ranking. The 2016 BMS marketing assessment in India showed the high standards of the India Infant Milk Substitutes, Feeding Bottles and Infant Foods (Regulation of Production, Supply and Distribution) Act, 1992 as amended in 2003 (IMS Act) and demonstrated a low number of incidences of non-compliance by companies. Therefore, a BMS marketing assessment was not incorporated in this Index edition.
Certain products and related topics are beyond the scope of this Index:
- Products intended to address acute undernutrition or other special nutrition needs
- Alcoholic beverages
- Products that are a part of a formal weight management program
Other issues that are related to the social and environmental impact of food and beverage companies but are outside the scope of the ATNI Index approach – as other accountability mechanisms cover them – include:
- Water management practices
- Environmental sustainability, including sourcing of ingredients
- Impact on climate change
- Fair treatment of workers and communities
- Crop breeding (e.g. hybridization and genetic modification)

Scope of the assessed companies
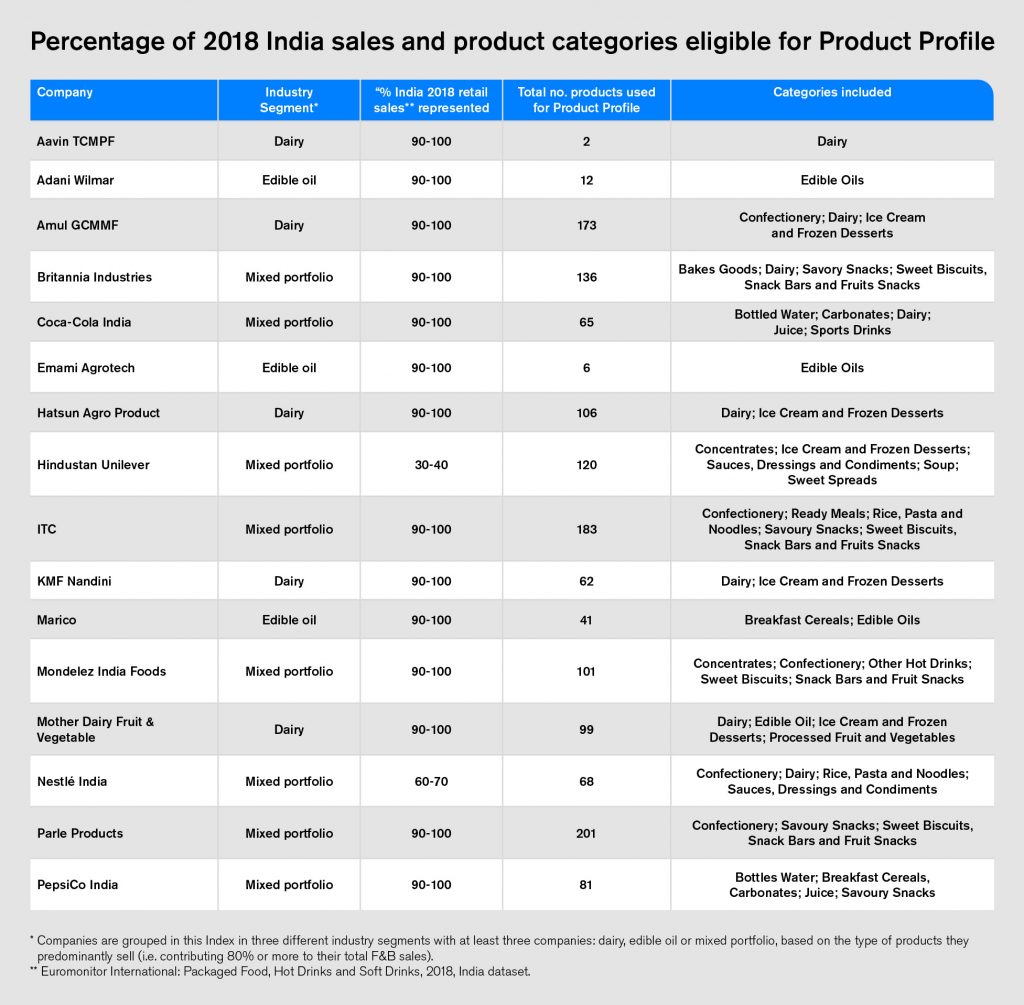
The India Index 2020 ranks the 16 largest food and beverage manufacturers active in the Indian market. Together, they accounted for over 31% of the processed food and beverage market share in India in 2018, generating a total of just over INR 1,800 billion in revenue . The number of companies assessed in this Index has extended from the nine in 2016 to 16 in 2019 with the addition of more India-headquartered companies.
The newly included companies mainly operate in the Dairy and Edible Oil food industry segments, which have a significant impact on the nutrition and health of Indian consumers, even with their potentially limited product portfolios. For more details on the companies included, and the product categories selected for the product assessment in the Product Profile, see table below.

Methodology
ATNI assesses food and beverage manufacturers’ nutrition-related contributions and progress in India through 99 indicators, which are organized into seven categories (A-G). Indicators are the basic ‘units’ of information that ATNI relies upon for its first stage assessments to measure company performance. ATNI’s approach is centered on three types of indicators: commitment, performance and disclosure.
Weighting of the indicator scores is applied at various levels. The performance indicators, for example, have double the weight of the commitment and disclosure indicators. All criteria have identical weights within a category except for Category B which includes the Product Profile score. For the weighting approach in the categories below.
The Product Profile is an important and complementary component of the Index that adds an objective, quantitative assessment of companies’ product portfolios. Its objective is to assess the mean nutritional quality of companies’ portfolios as well as their performance against peers products in the same categories. In addition to providing an overview of the ‘healthiness’ of products within categories, it also assesses the extent to which companies’ products meet nutritional standards to market products to children.

Methodology changes since 2016
The second iteration of the India Spotlight Index has some important methodology updates, which were necessary in order to incorporate the latest national guidelines, norms and accepted good practices. In addition, feedback from the previous India Spotlight Index 2016 and stakeholders’ roundtables was carefully evaluated. For example, indicators asking about companies’ employee wellbeing policies and practices have been extended in scope to include other actors from across the food supply chain and elements of nutrition literacy have been introduced in Category E.
Overall, the India Index 2020 has less indicators compared to the 2016 edition, reducing emphasis on indicators asking for companies’ non-commercial strategies, policies and practices in order to place more emphasis on their commercial practices.
The most significant change in methodology is the merge of The Corporate Profile and the Product Profile sections. In the previous Index, two separate scores were reported for each element. For this Index, Product Profile results have been incorporated into Category B of the methodology, resulting in one comprehensive score for each of the companies assessed, and one overall ranking. For the Product Profile, the World Health Organization’s (WHO) South East Asia Region (SEAR) Nutrient Profiling model is applied to determine products suitable for marketing to children. The previous Index applied the WHO Regional Office for Europe criteria as the WHO SEAR model was not yet published.
Another important change in methodology is an integrated assessment of the companies’ approaches to addressing the double burden of malnutrition, in contrast to assessing companies’ approaches to undernutrition through a separate section and with specific indicators in .
The 2016 Index assessed what the companies were doing to address the nutrition and health needs of low-income populations, whilst this edition focuses on the needs of population groups at high risk or experiencing malnutrition in all relevant regions in India.
Acknowledging that food safety remains a priority in the country, the Index methodology assesses whether companies have a robust food safety management system and/or food safety certifications. Overall, the Index aims to track food companies’ contributions to national initiatives such as the National Nutrition Strategy, the National Nutrition Mission also known as POSHAN Abhiyaan, and supporting efforts of the Food Safety and Standards Authority of India (FSSAI).
Finally, an indicator on food loss and food waste has been introduced, to draw attention to the links between nutrition and food system sustainability. The indicator aims to assess the extent to which the company has mechanisms in place to prevent and reduce food loss and waste in the production process. For more details, access the Methodology document here.
Limitations
The ATNI Index approach and India Index 2020 have various research limitations, including those related to: the availability of information accessible by ATNI; reliance on companies’ self-reported data; the comparability with the previous India Index results; and specific Product Profile limitations. A complete description of the India Index 2020 methodology and its limitations can be found here. Specific information on the Product Profile methodology and its research limitations can be found here.
ATNI’s methodology relies to a large extent on companies’ self-reported information and data which is assessed and verified by research analysts based on evidence provided by companies. For example, in Category D, which addresses responsible marketing practices, ATNI assesses companies’ public commitments and evidence of performing accordingly by assessing whether third-party audits of their marketing practices are in place and results are disclosed publicly. At present, ATNI does not have the means to assess companies’ marketing practices directly.
Companies may disclose limited or no information publicly, but ATNI offers companies the option to engage in the research process to provide clarifications or additional information under a Non-Disclosure Agreement (NDA) as needed. Scores for companies that provide limited or no public disclosure of nutrition-related information and that choose not to engage with ATNI to provide undisclosed information may be low due to a lack of information available to ATNI and, therefore, may not be representative of what those companies actually do.
Due to the integration of Product Profile scores in the Corporate Profile and a significant number of structural changes to the methodology, the overall comparability between the 2016 and 2020 Indexes is limited. In general, the scores and relative performance per category or topic area can still be compared, e.g. regarding Governance (Category A) and Marketing (Category D), as well as comparisons between individual indicators that remain unchanged.
Finally, the Product Profile component has limitations related to the availability and quality of data, as well as the nutrient profile models used. The quality of the assessment depends on the comprehensiveness of the product and nutrient data. Limitations in available data lead to the use of imputed nutrient data and exclusion of products. Furthermore, the HSR system does not score some types of products for which nutrition label information is not available, such as coffee, tea, herbs and condiments. Baby foods, complementary foods and minimally processed agricultural products are also excluded from the study as the HSR system is not designed to assess these specialized products. Therefore, for companies that derive a substantial proportion of their sales from excluded categories, the Product Profile results only apply to the remaining, included fraction of the companies’ portfolios. Finally, the data that is used for sales-weighting the results is based on sales value and is of limited granularity, as it is applied at the product category level rather than for the individual product. Due to limited availability of information, the sales-weighting approach cannot currently be based upon sales volume information.