ATNI is pleased to present the US Access to Nutrition Index 2022, four years after the first Index was published in 2018.

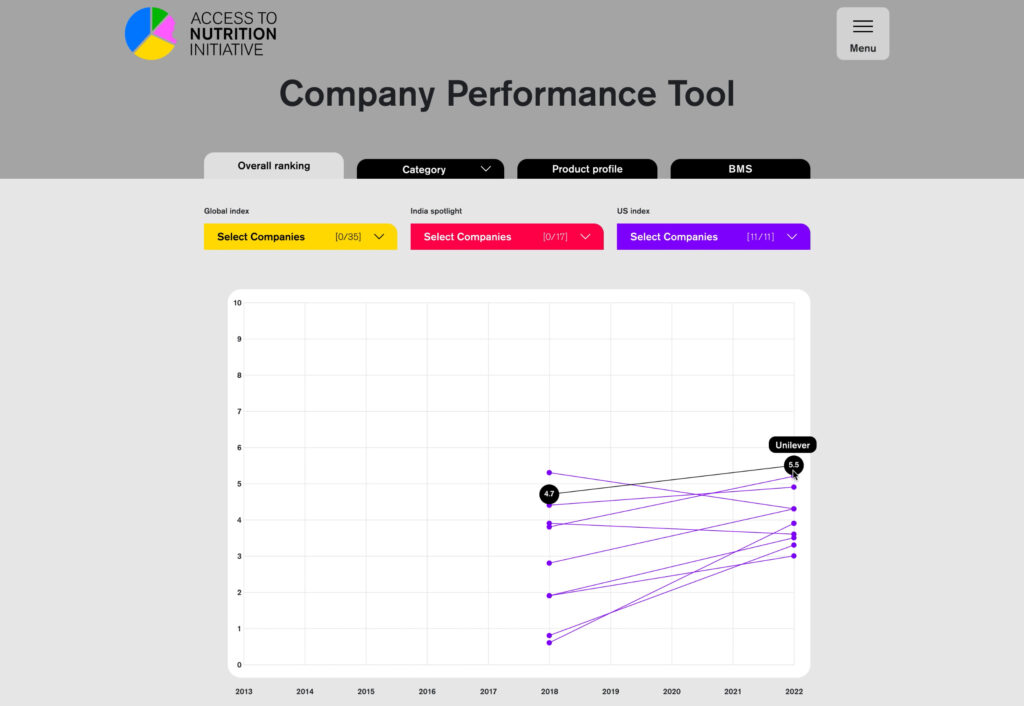
The US Index is a benchmark comparing the commitments and performance of the eleven largest food manufacturers active in the US to deliver healthy, affordable food and beverages enabling consumers to reach healthier diets and to prevent hunger.

All companies assessed have now placed a greater focus on nutrition in their corporate strategies, and ten manufacturers in some way define what they consider “healthy”. Companies are making explicit commitments to reduce diet related diseases.  However, companies must now turn these commitments and policies into action.  Despite the introduction of healthier varieties in some product categories by some companies, the combined product portfolios of all eleven companies – representing a sales value of around $170 billion in 2021 and accounting for approximately 30 percent of all US food and beverage sales – have not become healthier.

The opportunity and urgent need is for all companies to produce and market more healthy products and spend less money marketing unhealthy products.

The food and beverage industry has an important and prominent role to play in addressing key nutrition challenges in the US food system, including food and nutrition insecurity, hunger, high rates of obesity and diet-related chronic diseases, and related nutrition and health inequities. The US Index is intended to be used by companies and by other actors in nutrition and health – including policymakers, investors, and international and non-governmental organizations – to help the food and beverage industry deliver on commitments to address these nutrition challenges. The Index can act as a catalyst to bring about further change in the country’s food and beverage sector. It can help inform and further the US Government’s agenda for hunger, nutrition and health with metrics, data, and recommendations to drive private sector contributions on food access and affordability and the healthiness of packaged food and beverages on the US market.

Read the Executive Summary or Report In Brief for this Index.

Ranking

Most companies scored marginally higher than in 2018. The top score of 5.6 and average score of 4.2 represent limited performance across all companies. Higher scores are primarily a result of more comprehensive and specific nutrition commitments, somehow defining “healthy”, setting reformulation targets, and better transparency regarding companies’ nutrition strategies and performance.

A
Governance
B
Products
C
Accessibility
D
Marketing
E
Workforce
F
Labeling
G
Engagement

Methodology

The methodology assesses companies against US-specific and international guidelines, standards and norms, and accepted industry best practices. There are seven categories (topic areas) within the methodology, each carrying a specific weight used to calculate the total Index score on a scale of 0 to 10 with 10 being the highest: A. Nutrition governance and management (12.5%), B. Product portfolio healthiness score, reformulation targets and healthiness criteria (35%), C. Access and affordability of healthy foods (17.5%), Responsible marketing (20%), E. Workforce nutrition (5%), F. Labeling (5%), and G. Lobbying in support of public health interests and engaging external stakeholders to improve companies’ nutrition strategies (5%). A total of 127 indicators are distributed between the different categories.

Company Scorecards

Based on estimated sales values of packaged foods and beverages in the US, the 11 leading manufacturers included in the US Index 2022 are:

Key Findings

Only a third of companies’ combined sales value for 11,041 products is derived from products meeting the “healthy” threshold. Companies must urgently improve their product portfolios and prioritize marketing of healthier products over unhealthy varieties.

Category Reports

The US Index 2022 assesses companies’ nutrition-related commitments and policies, practices and disclosure across seven categories. A product profiling exercise, assessing the healthiness of companies’ product portfolios using the Health Star Rating model is also part of the Corporate Profile.

Products
A1
Nutrition strategy
A2
Nutrition management
B1
Product Profile
B2
Product formulation
B3
Defining healthy products
C1
Product pricing
C2
Product distribution
D1
Marketing policy
D2
Marketing to children
D3
Auditing and compliance
E1
Employee health
E2
Breastfeeding support
F1
Product labeling
G1
Influencing policymakers
G2
Stakeholder engagement

Category A looks at companies’ corporate nutrition strategies and governance, and accountability systems related to nutrition. This Category carries 12.5% of the weight of the overall score. Category A assesses the extent to which a company’s commercial strategy includes a specific commitment to contribute to improved nutrition, and whether this approach is embedded within its governance and accountability mechanisms.

Category B looks at companies' efforts to formulate appropriate products, and carries 35% of the weight of the overall Index score. Category B also assesses the extent to which companies have established product (re)formulation targets, and the characteristics and transparency of their nutrient profiling models.

Product Profile

The Product Profile is an independent analysis of the healthiness of companies’ US product portfolios.

Read the Product Profile

Category C assesses companies' efforts to make healthy products affordable and accessible for all consumers in the US by ensuring they are priced appropriately and adequately distributed. Category C holds 17.5% weight of the overall Index score.

Category D assesses the scope and strength of companies’ corporate marketing policies for both general audiences and children – specifically how they align to best -practice marketing guidance and standards, and their systems for auditing compliance with their policies. Category D accounts for 20% of the overall Index score.

Category E assesses the extent to which companies support the nutritional wellbeing of their staff by implementing workforce nutrition programs; and support parent-friendly working practices, including for breastfeeding mothers at work. Category E holds 5% of the overall Index score.

Category F assesses the extent to which companies provide consumers with comprehensive and easily understandable information about the nutritional composition and potential health impact of their products through labeling – both in-store and online. Category F accounts for 5% of the overall Index score.

Category G focuses on companies' engagement with government bodies and representatives through lobbying, along with their stakeholder engagement with civil society and academia on nutrition-related issues. Category G holds 5% weight of the overall Index score.

Notable Examples

    • A

    Unilever makes nutrition and health part of their mission statement in addition to their core commercial strategies. In 2020, Unilever launched its new strategy – The Unilever Compass – which builds upon the Unilever Sustainable Living Plan (USLP) 2010-2020. The company’s purpose is to ‘make sustainable living common place’. Under the ‘Improve people’s health, confidence and wellbeing’ pillar, the company has set six goals on Positive Nutrition, including to “Double the number of products sold that deliver positive nutrition by 2025” and for “70% of our portfolio to meet World Health Organization (WHO)-aligned nutritional standards by 2022.” These goals are part of the company’s ‘Future Foods’ strategy. Further, in July 2020, the company published a plan titled ‘Transforming the world’s food system for a more nutritious, more sustainable, and fairer future’, in which it outlines four ways the company is leading change. These include: 1) Nutritious foods and balanced diets; 2) Making plant-based choices available for all; 3) Less food waste; and 4) Food that is fair and doesn’t cost the earth. On its US website, Unilever has a dedicated section to report progress on its nutrition efforts, including US-specific progress on nutrition targets. In addition, on its global website ‘Sustainability performance data’, Unilever publishes progress by country.

    • B

    PepsiCo published its NPM in a peer-reviewed journal article. The article presents PepsiCo Nutrition Criteria (PNC), a new internal NPM designed to guide and monitor improvements in nutrient density and the overall nutritional quality of foods and beverages. The new PNC nutrient profiling model assigns food products to four classes of increasing nutritional value, based on the content of nutrients to limit, along with nutrients and ingredients to encourage. The nutrient standards used for category assignment follow those developed by global dietary authorities. Standards are proposed for calories, sodium, added sugars, saturated fats, and industrially produced trans fats. In the article, the company provides examples of recently reformulated products according to these guidelines.

    • C

    In 2021, Campbell began tracking the average cost per serving of its ‘Nutrition Focused Foods’ against the average cost per serving of the portfolio overall and disclosing the results. It found that these foods cost USD 0.62 per serving on average, compared to USD 0.65 per serving for its entire portfolio. This is the first company in ATNI’s Indexes to do this and publicize it, and the company is well-placed to set SMART targets to improve the price differential further in the future. No other companies were found to track the relative affordability of their products.

    • D

    Unilever made a new commitment not to market their products to children and, in April 2022, also announced that it is raising the age threshold of this commitment to all under 16s – being the first US Index company to use this age limit and the closest to the International Child Rights Convention’s definition of a ‘child’ (18 years).

    • E

    Kellogg commits to support employee health through its Total Health program, which includes personal health-related outcomes such as BMI, blood pressure, blood glucose, and LDL cholesterol for its program’s participants; as well as expected outcomes such as improved performance at work, lower absenteeism, and improved people safety. This program is offered to all employees and their family members. Kellogg’s employee health programs provide support by offering healthy food at work (via Sodexo), nutrition education (through Total Health), and nutrition-focused health checks (via Total Health).

    • F

    Mars provides front-of-pack (FOP) information on the amount of calories, sodium, sugar, and fats per serving on 100% of product labels, with exemptions including “gum, mints, drops, medicated confectionery, herbs, spices and condiments.” Exempted foods are those with nutritional or dietary insignificance, or foods in small packs. The company confirmed that this commitment spans both Mars Food and Mars Wrigley.

    • G

    Unilever publishes a relatively comprehensive range of ‘Advocacy and Policy Asks’ on its website. Moreover, in its ‘Position on Sugar’ and ‘Position on Nutrition Labeling’ documents, the company provides additional detail, publicly specifying under which conditions the company would support (or not support) certain policies.

  • Show all

Future Opportunities

ATNI will share and reflect on the outcomes of this Index with the companies assessed, and with ATNI’s investor signatories that engage with the companies, to discuss required follow-up action. The Index results will also be discussed with a wider group of parties interested in nutrition and food systems during various events, to determine ways in which the industry response to malnutrition can and should be strengthened to ensure healthier diets for all. The insights from the Index will be used to identify areas in our Index methodologies and other accountability tools that require further development to amplify ATNI’s efforts to address nutrition challenges.

Amplifying Impact

Companies urgently need to deliver on the Sustainable Development Goals

Impact Goal Icon

End hunger, achieve
food security and
improved nutrition

Impact Goal Icon

Ensure healthy
lives and promote
well-being for all

email dropdown linkedin facebook twitter icon_input-select BMS Close Download Hamburger Performance Pijl Plus Product-Profile Share google-doc-tracking-XL Performance comparison-tool egagement-tracker-tool