Methodology
Global Index
2021
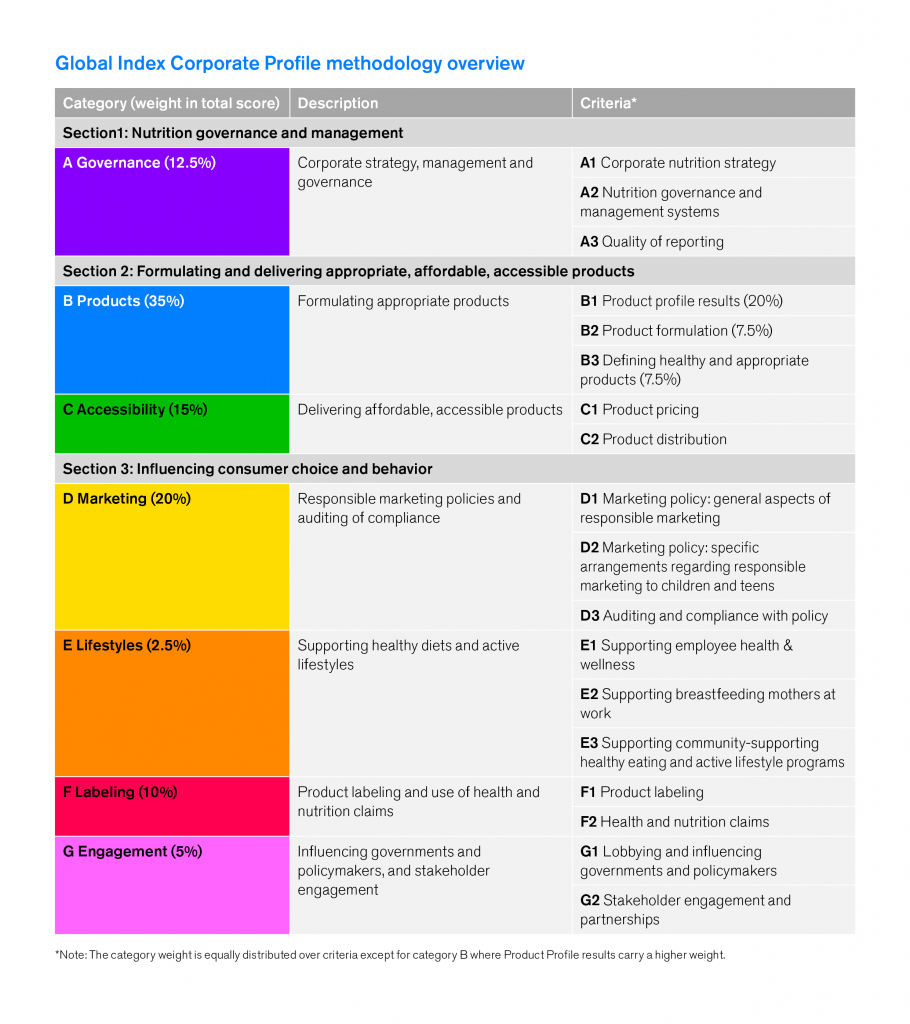
The ATNI Corporate Profile methodology used for the Global Index 2021 assesses companies’ nutrition-related commitments and policies, practices, and disclosure across seven categories. A product profiling exercise, assessing the healthiness of companies’ product portfolios using the Health Star Rating model, is also part of the Corporate Profile. Similar to 2018, scores of companies that have been assessed for the 2021 BMS/CF Marketing Index are adjusted based on their BMS/CF scores.
The full methodology can be accessed here:
Note that there have been some changes to the methodology and presentation since the 2018 Global Index:
- Assessment of the nutritional quality of the products of Index companies using the government endorsed HSR nutrient profiling model, known as the Product Profile, is now incorporated within Category B (Products) and part of the overall Index scoring algorithm, rather than separately considered. The other two components of the Product Profile include assessment of the companies’ performance within product categories and assessment of the change in product portfolio healthiness compared with the 2018 Product Profile.
- In the 2018 Global Index, undernutrition was a separate section for all companies that had significant market shares in low- and middle-income countries (accounting for 25% of overall score). In 2021, this has been replaced by indicators assessing all companies on their actions to target priority populations at risk of any form of malnutrition throughout the methodology.
- The weighting of the Categories has been adjusted. Category B (Products) now carries 35% of the overall weight of the Corporate Profile, compared to 25% in 2018. The Product Profile (Criterion B1), incorporated within category B, accounts for 20% of the overall Index weight, while Product (re-)formulation efforts (Criterion B2) and defining healthy products (nutrient profiling, Criterion B3) account for a further 7.5% each. Categories C and F carry 5% less weight to incorporate this change. Therefore, this Index places more emphasis on the nutritional quality of their portfolios, companies’ performance on nutritional quality of products within categories among peers, and changes in product portfolio nutrition quality over time.
- ATNI has been stricter in requiring evidence for the continuation of commitments made before 2018, and when applying standards and requirements from leading international organizations such as the World Health Organization (WHO) Global Action Plan and the United Nations (UN) Sustainable Development Goals. Donations by companies are acknowledged but receive substantially less credit than commercial activities to address malnutrition. At the same time, companies were assessed on new indicators, such as actions targeting priority populations at high risk of malnutrition.
- The number of companies in the Global Index has also increased from 22 (2018) to 25 (2021). The Global Index 2021 company selection identified 25 of the largest F&B manufacturers, consisting of the top 20 companies by total global financial year revenues, and also included companies that were included in earlier Global Indexes.
Please note that the findings of this Index regarding companies’ performance are based to a large extent on information shared by companies, in addition to information that is available in the public domain. Several factors beyond the companies’ control may impact the availability of information, such as differences in disclosure requirements among countries or capacity constraints within companies due to, among other factors, the Covid-19 pandemic. Therefore, in the case of limited or no engagement by such companies, this Index may not represent the full extent of their efforts.


