Products
Product Profile and Product Formulation
Category B consists of three criteria:
- B1 Product Profile (20% of overall score)
- B2 Product Formulation (7.5% of overall score)
- B3 Nutrient Profiling Model (NPM): Defining ‘healthy’ products (7.5% of overall score)
To perform well in this category, companies should:
- Derive a majority of US sales from healthier products, measured by ATNI’s Product Profile (using the Health Star Rating (HSR))
- Commit to increasing sales/proportion of healthier products in their US portfolios and report on progress annually
- Set and disclose SMART (Specific, Measurable, Attainable, Relevant and Time-bound) product (re)formulation targets for both nutrients of concern and positive nutrients/ingredients
- Adopt and disclose details of an evidence-based NPM, applicable to the whole portfolio and which is externally validated or benchmarked against external standards
Ranking
Notable Examples
-
- B
PepsiCo published its NPM in a peer-reviewed journal article. The article presents PepsiCo Nutrition Criteria (PNC), a new internal NPM designed to guide and monitor improvements in nutrient density and the overall nutritional quality of foods and beverages. The new PNC nutrient profiling model assigns food products to four classes of increasing nutritional value, based on the content of nutrients to limit, along with nutrients and ingredients to encourage. The nutrient standards used for category assignment follow those developed by global dietary authorities. Standards are proposed for calories, sodium, added sugars, saturated fats, and industrially produced trans fats. In the article, the company provides examples of recently reformulated products according to these guidelines.
-
- B
Food & beverage manufacturers find it increasingly important to assure their stakeholders that their public metrics on nutrition are accurate and reliable. Unilever has set a target to increase sales by volume of products compliant with its own nutrition standards (70% of global portfolio to meet Unilever’s highest nutritional standards (HNS) standards by 2022). The company has selected this metric as part of its sustainability assurance program. In addition, the company provides US-specific reporting on progress against this target.
-
- B
Conagra uses NutriScore for some product categories. In its 2021 Citizenship report, the company describes the introduction of a new metric, Sustainable Nutrition, as measured by NutriScore A or B for vegan and vegetarian products. According to the company, 82% of its vegan and vegetarian meals and meat replacements currently qualify for this attribute. In addition, Conagra applies the FDA Healthy criteria to its Healthy Choice products, which include soups and ready-to-eat meals.
B1. Product Profile
The Product Profile is an objective assessment of the nutritional quality of packaged foods and beverages sold in the US market. ATNI rates companies using the Australian HSR. Products are rated between 0.5 stars (least healthy) to five stars (most healthy), and any product that scores 3.5 or above is considered ‘healthier’ (see Box 3).
ATNI commissioned an independent organization – The George Institute for Global Health (TGI) – to execute the nutrient profiling element of the Product Profile. More details on the methods, results, and limitations of the study are available in TGI’s report.
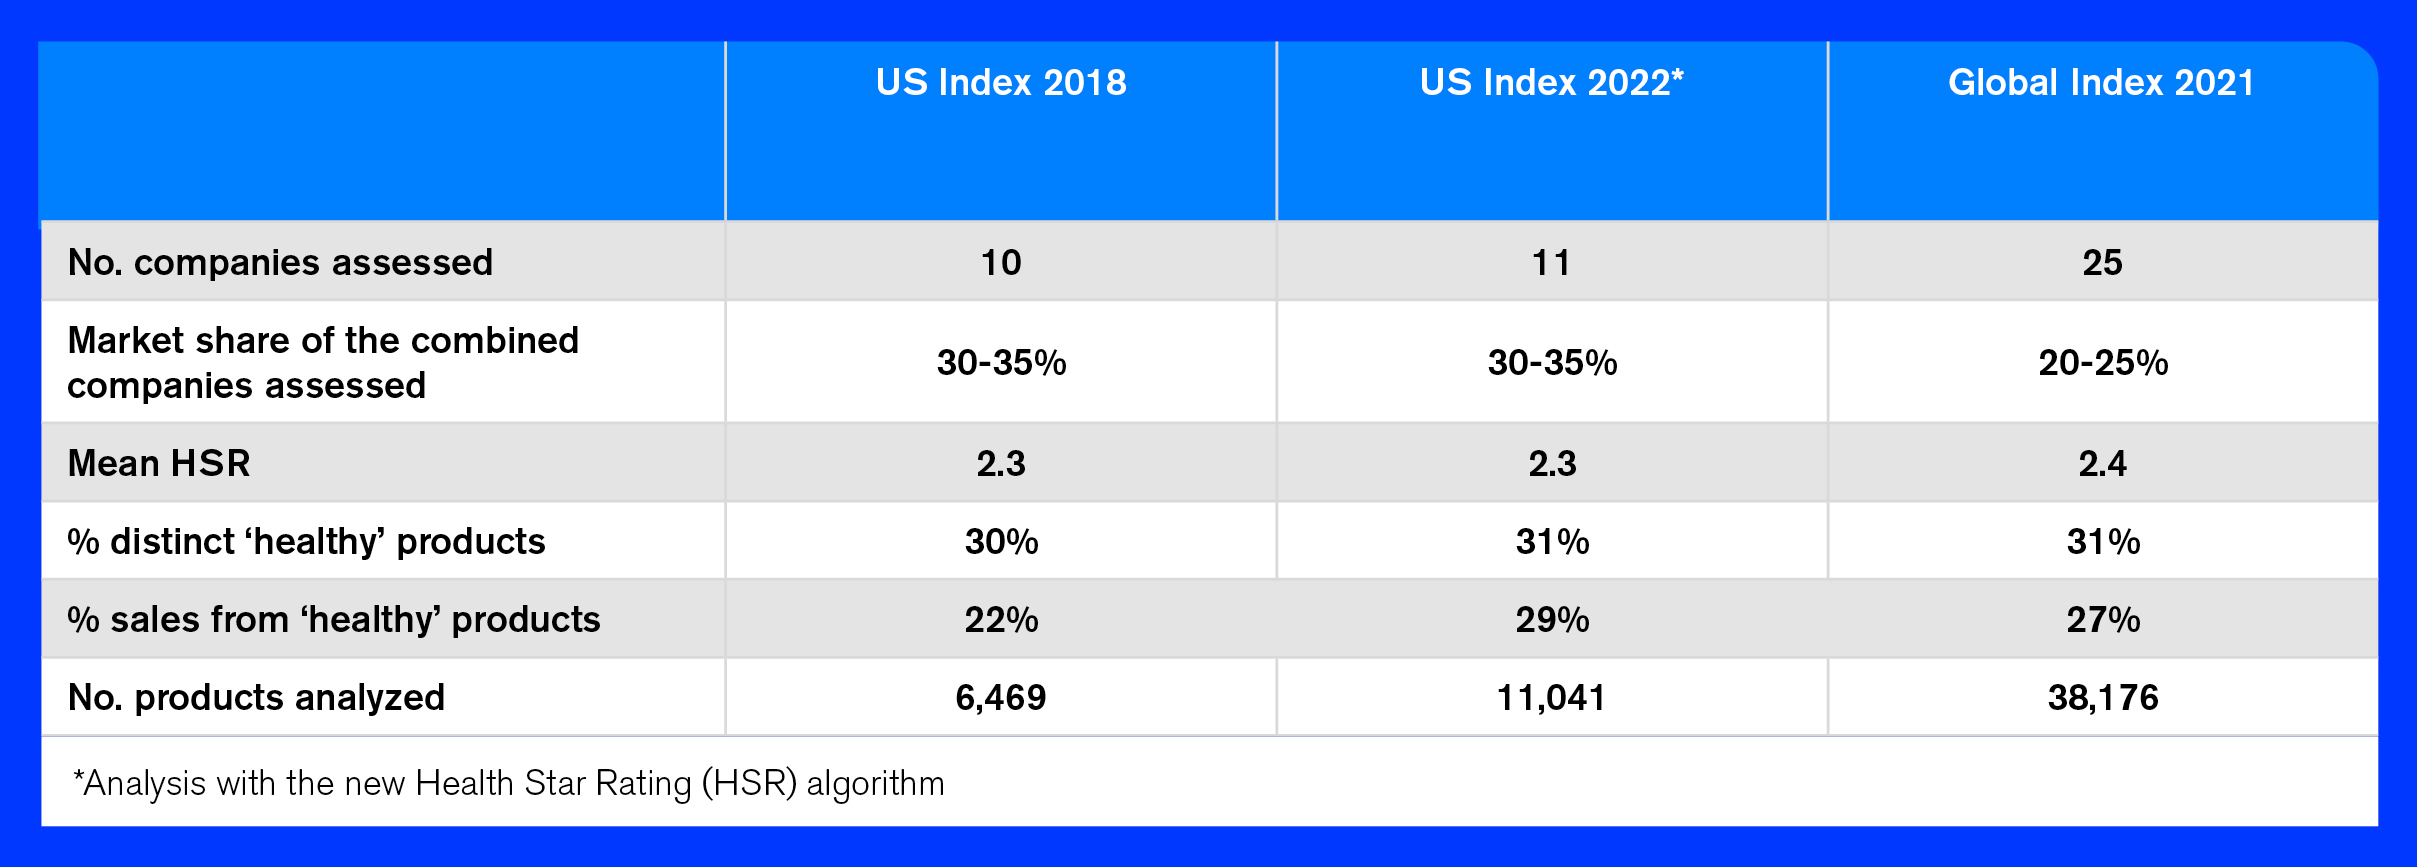
Read TGI’s Product Profile ReportThe Product Profile analyzed nutrition information for a total of 11,041 packaged food & beverage products sold by the 11 companies in the Index. These products represented an estimated retail sales value of more than USD 170bn in 2021, which accounted for approximately 26% of all US food & beverage sales. The percentage of each company’s 2021 sales covered in the Product Profile, the categories selected, and the total number of products assessed for each company are shown in Table 1.
Table 1. Percentage of US sales and product categories included in the Product Profile
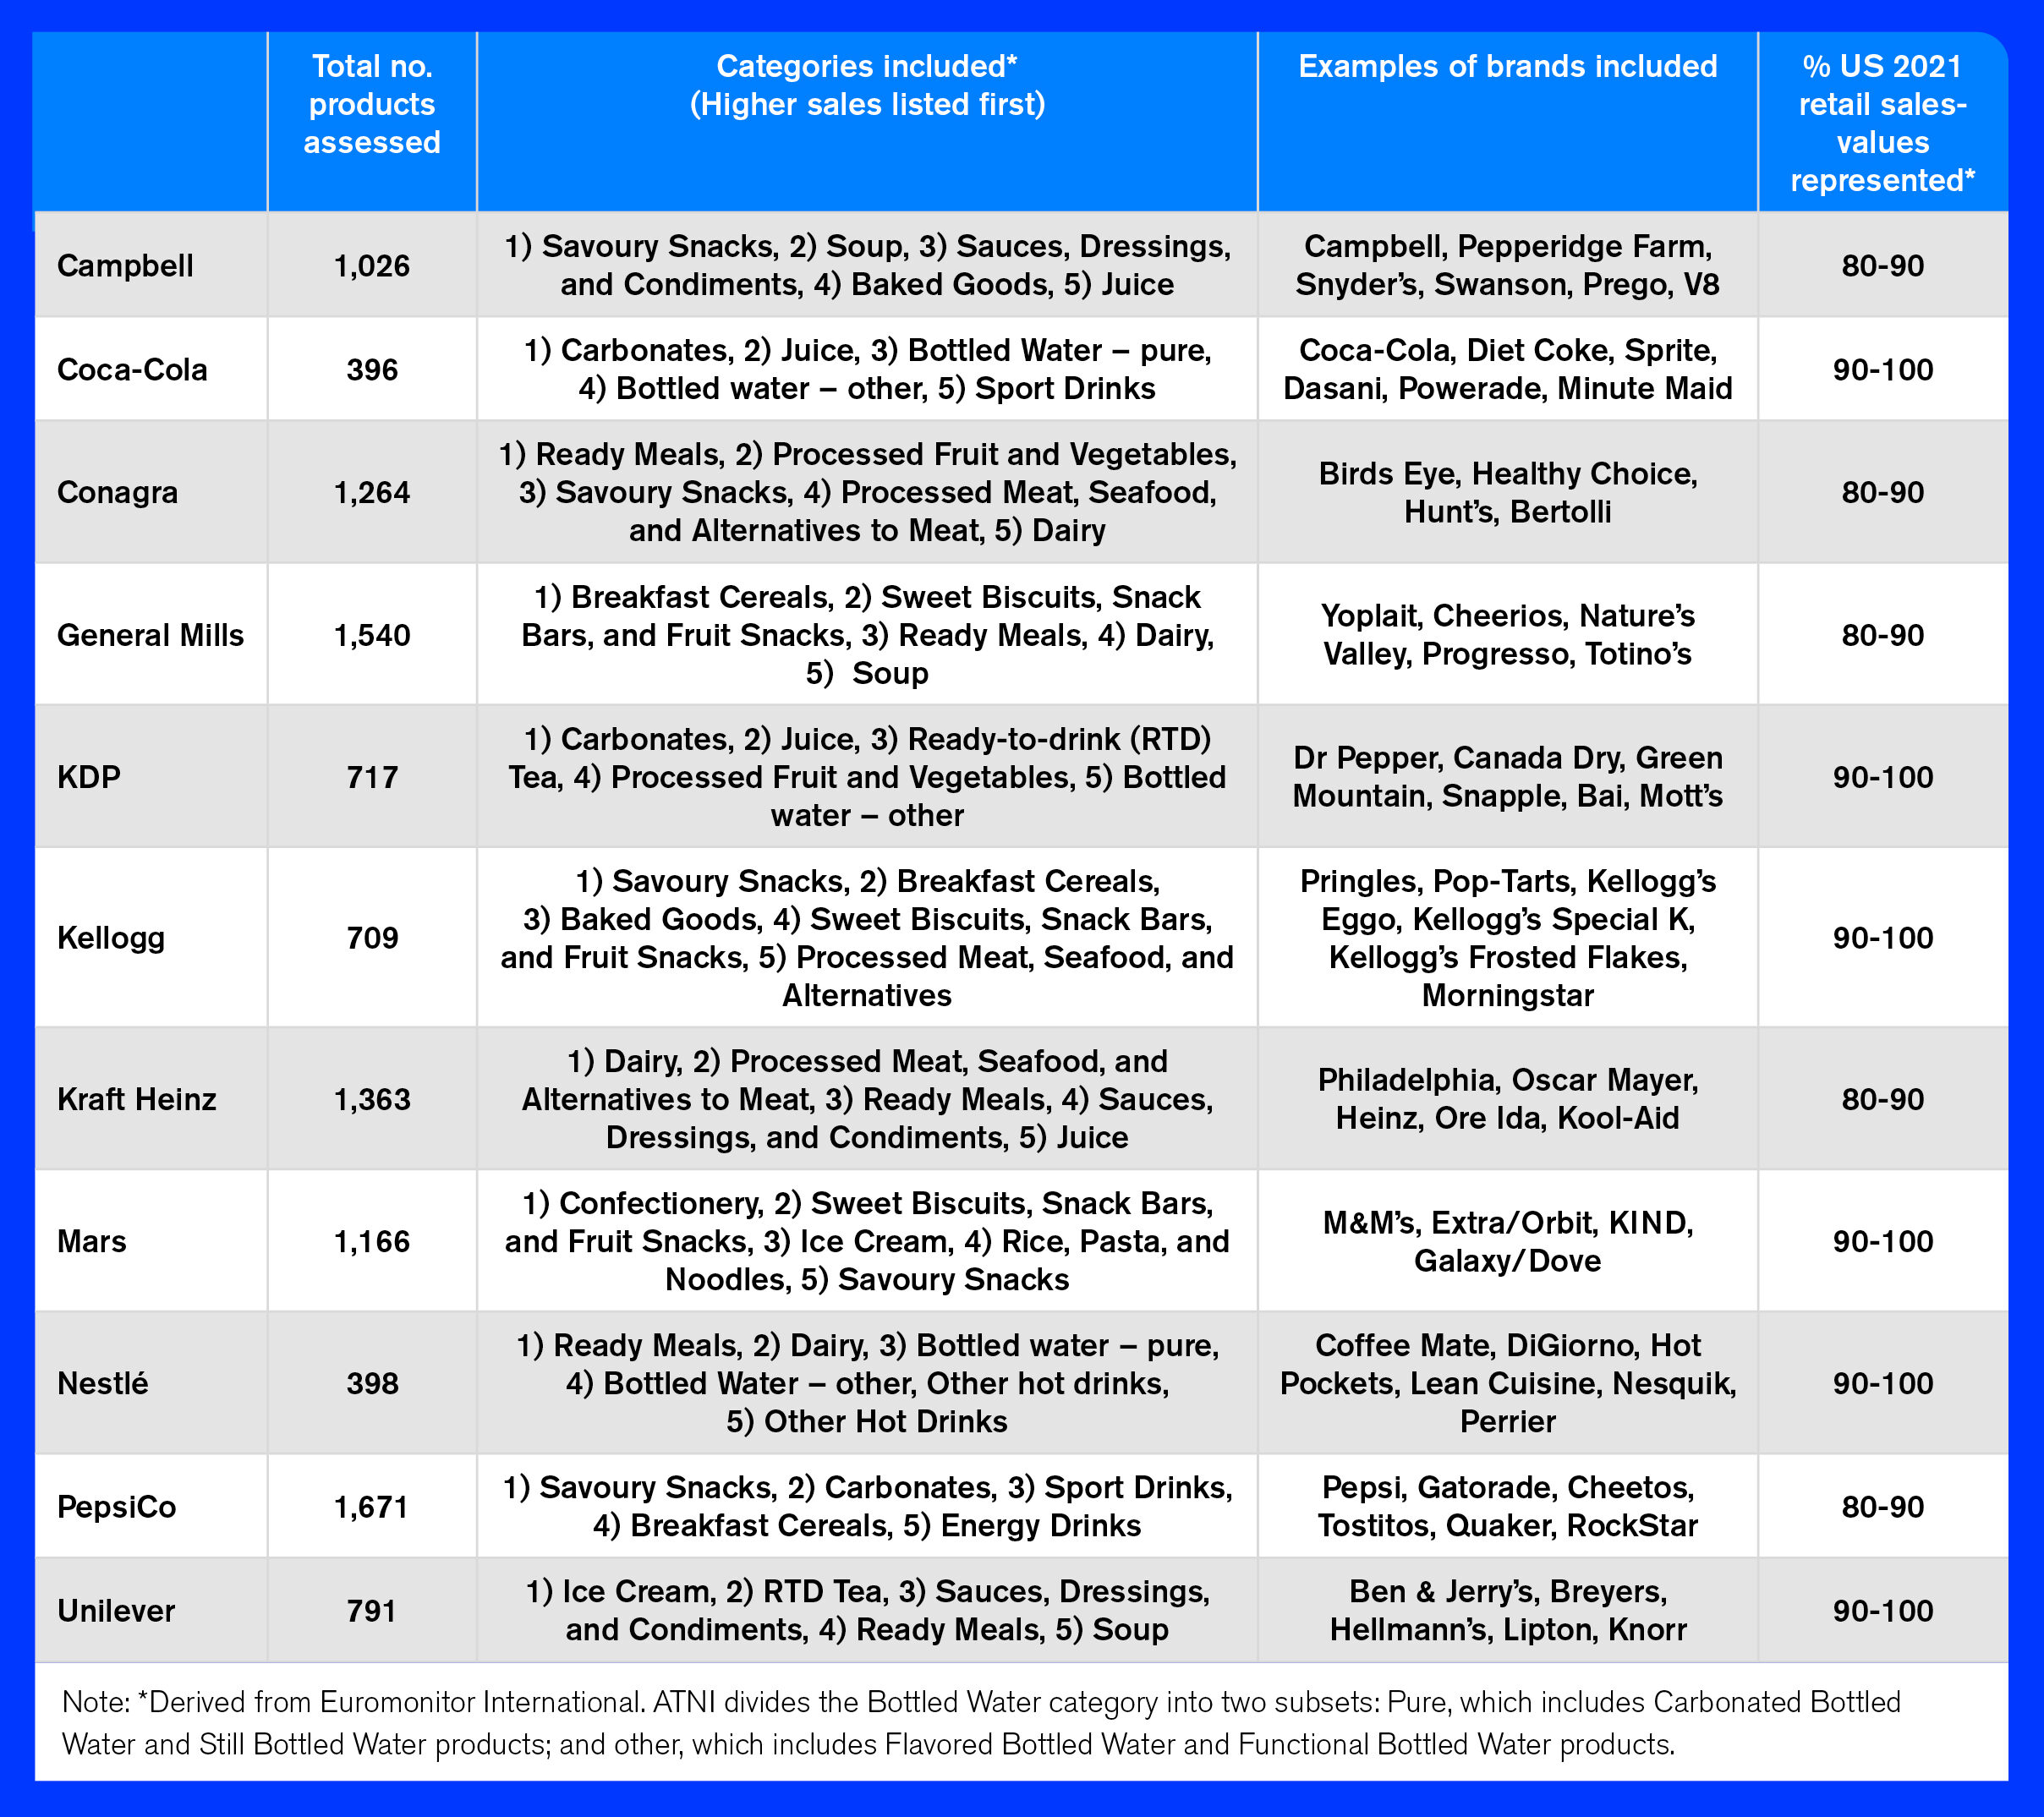
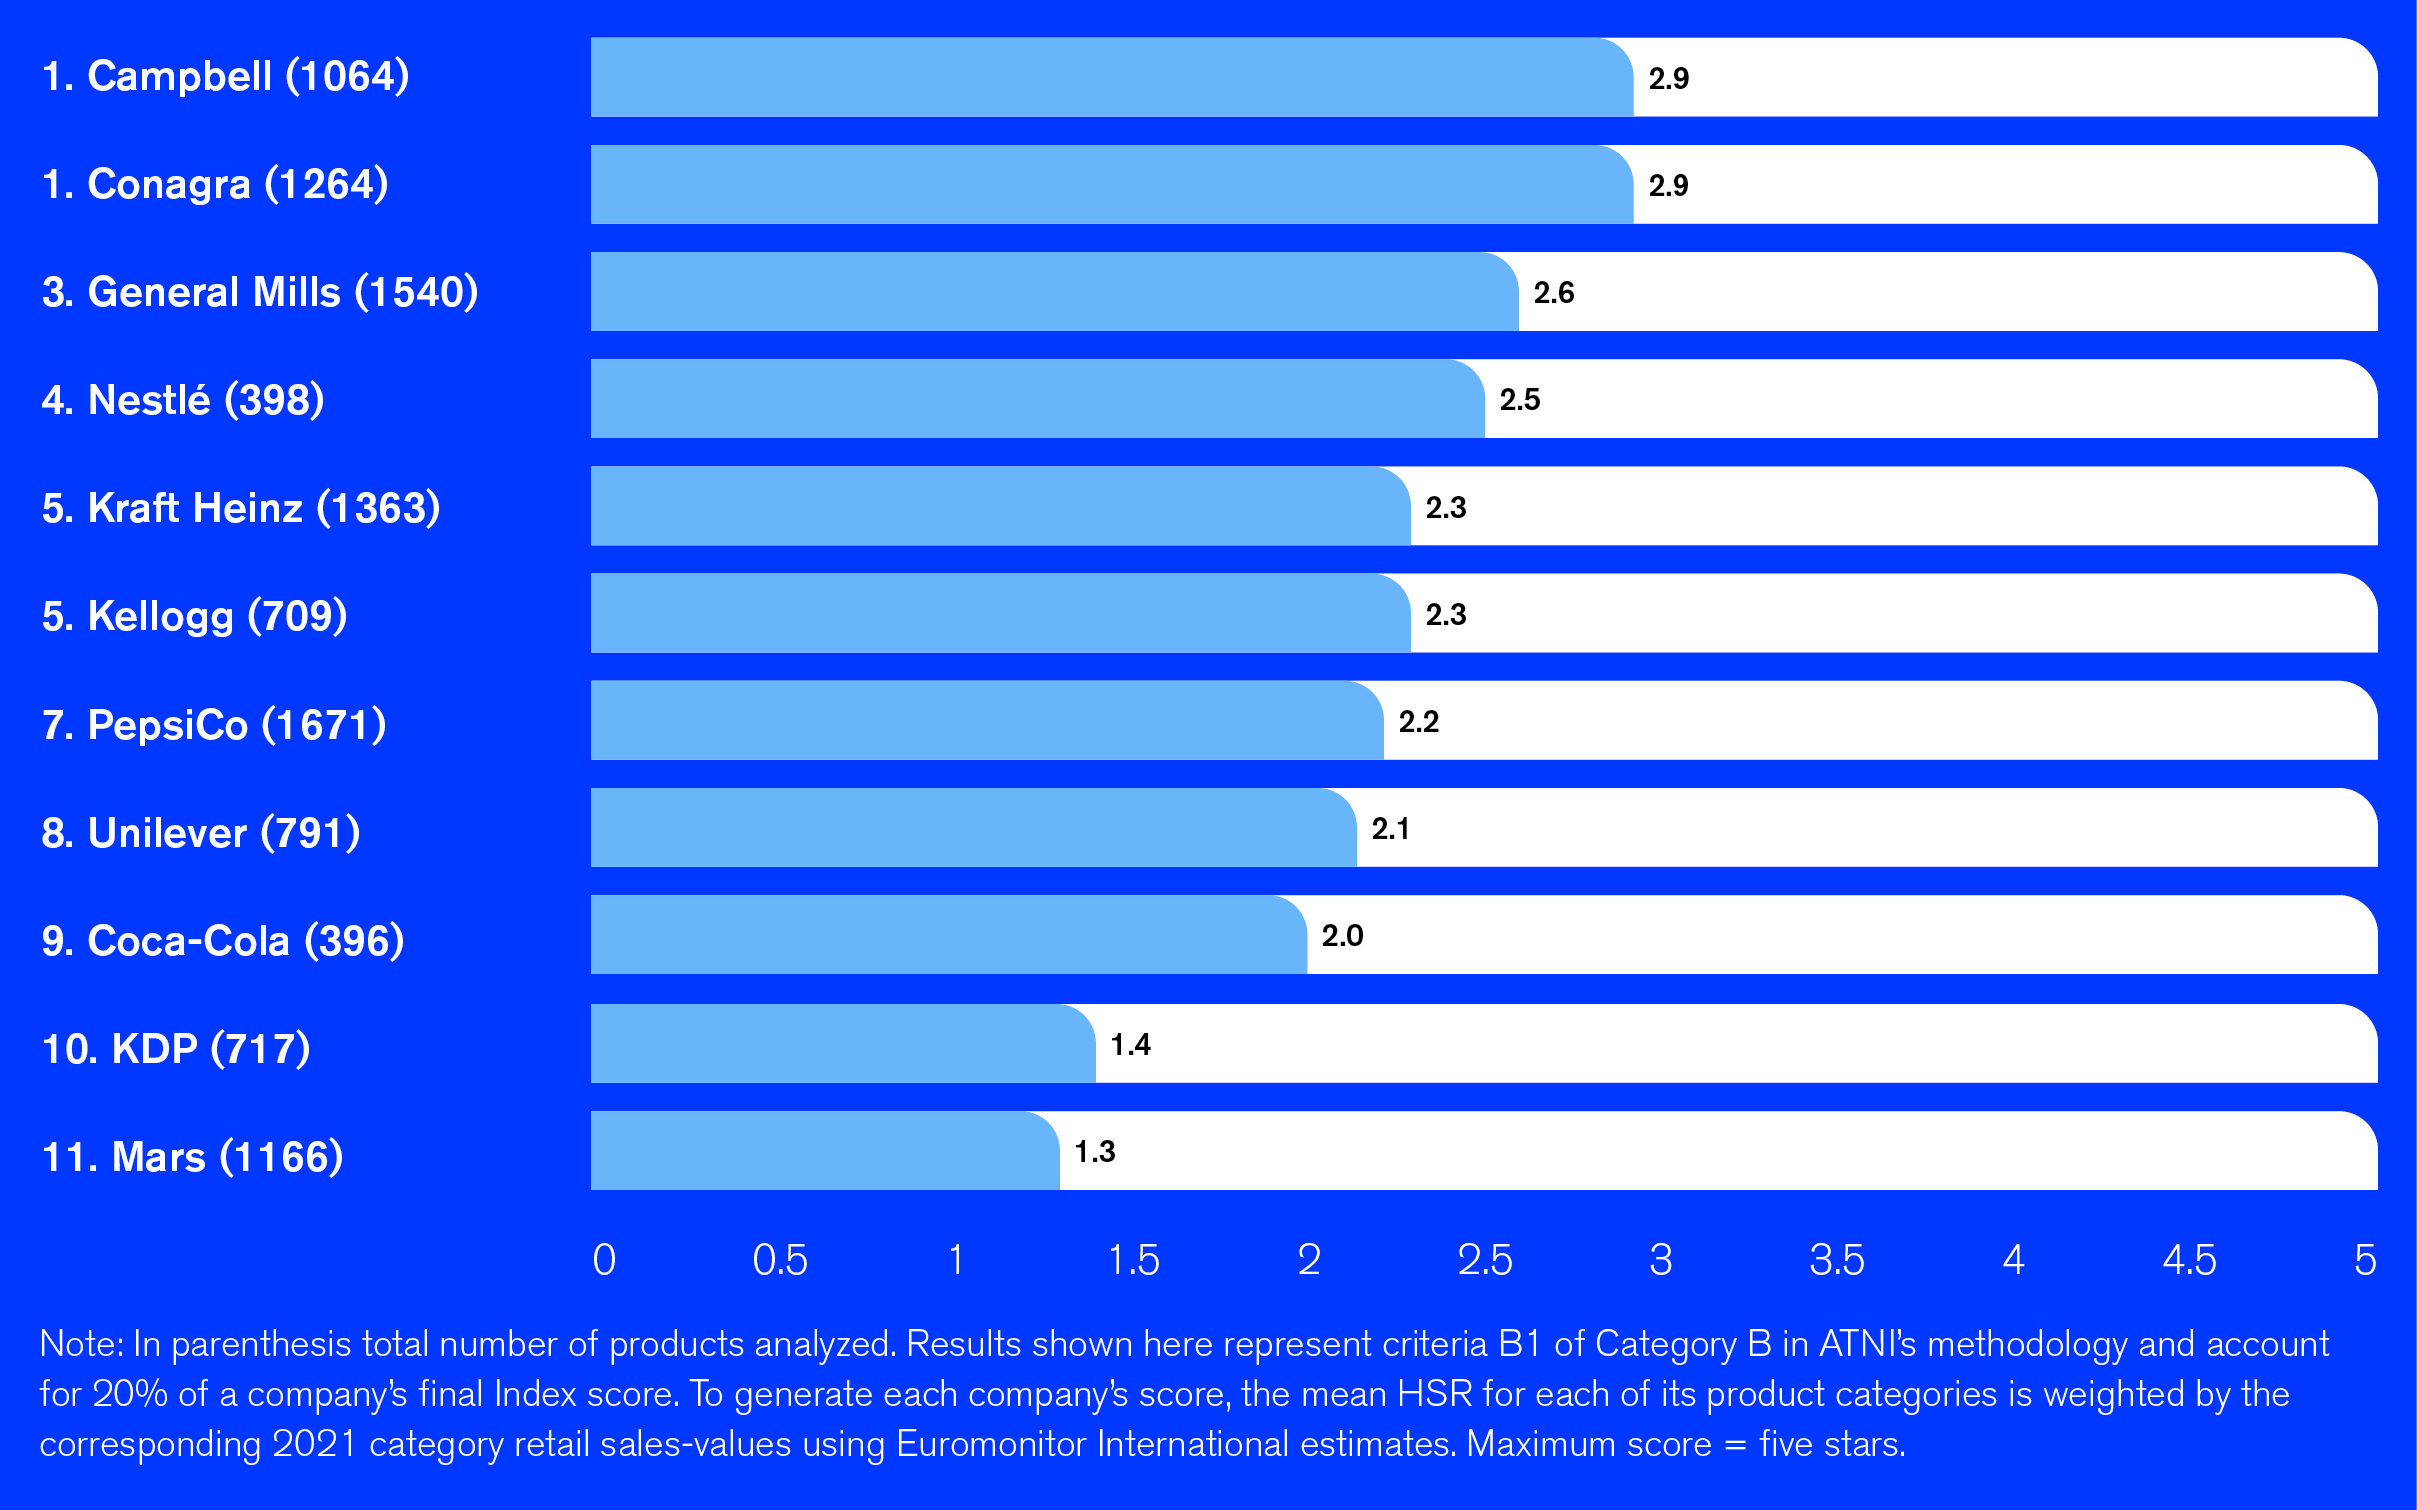
Out of all products analyzed (11,041), 31% met the ‘healthy’ threshold, (having an HSR of 3.5 or more), corresponding to 29% companies’ combined sales in 2021. The average HSR for all companies’ products combined was low (2.3 out of 5), with substantial variation observed between companies. Overall, companies with mixed portfolios performed better in the Product Profile, compared to those that derive most sales from less healthy categories –e.g. Mars from Confectionery, and KDP and Coca-Cola from Carbonates.
Conagra and Campbell show the highest scores for the Product Profile, both with a sales-weighted mean HSR of 2.9 out of 5. followed by General Mills (2.6) and Nestlé (2.5). It’s important to note that Conagra is active in product categories that score relatively well overall (Processed Fruits and Vegetables, and Ready Meals). Similarly, Campbell is active in the Soup and Sauces, Dressings, and Condiments categories. ATNI estimates that Conagra generated 49% of its 2021 US retail sales from products meeting the ‘healthy’ threshold – the highest proportion among companies assessed (see Figure 1).
Figure 1. Sales-weighted mean HSR and ranking
Click here to read further into the Product Profile’s category-level results.
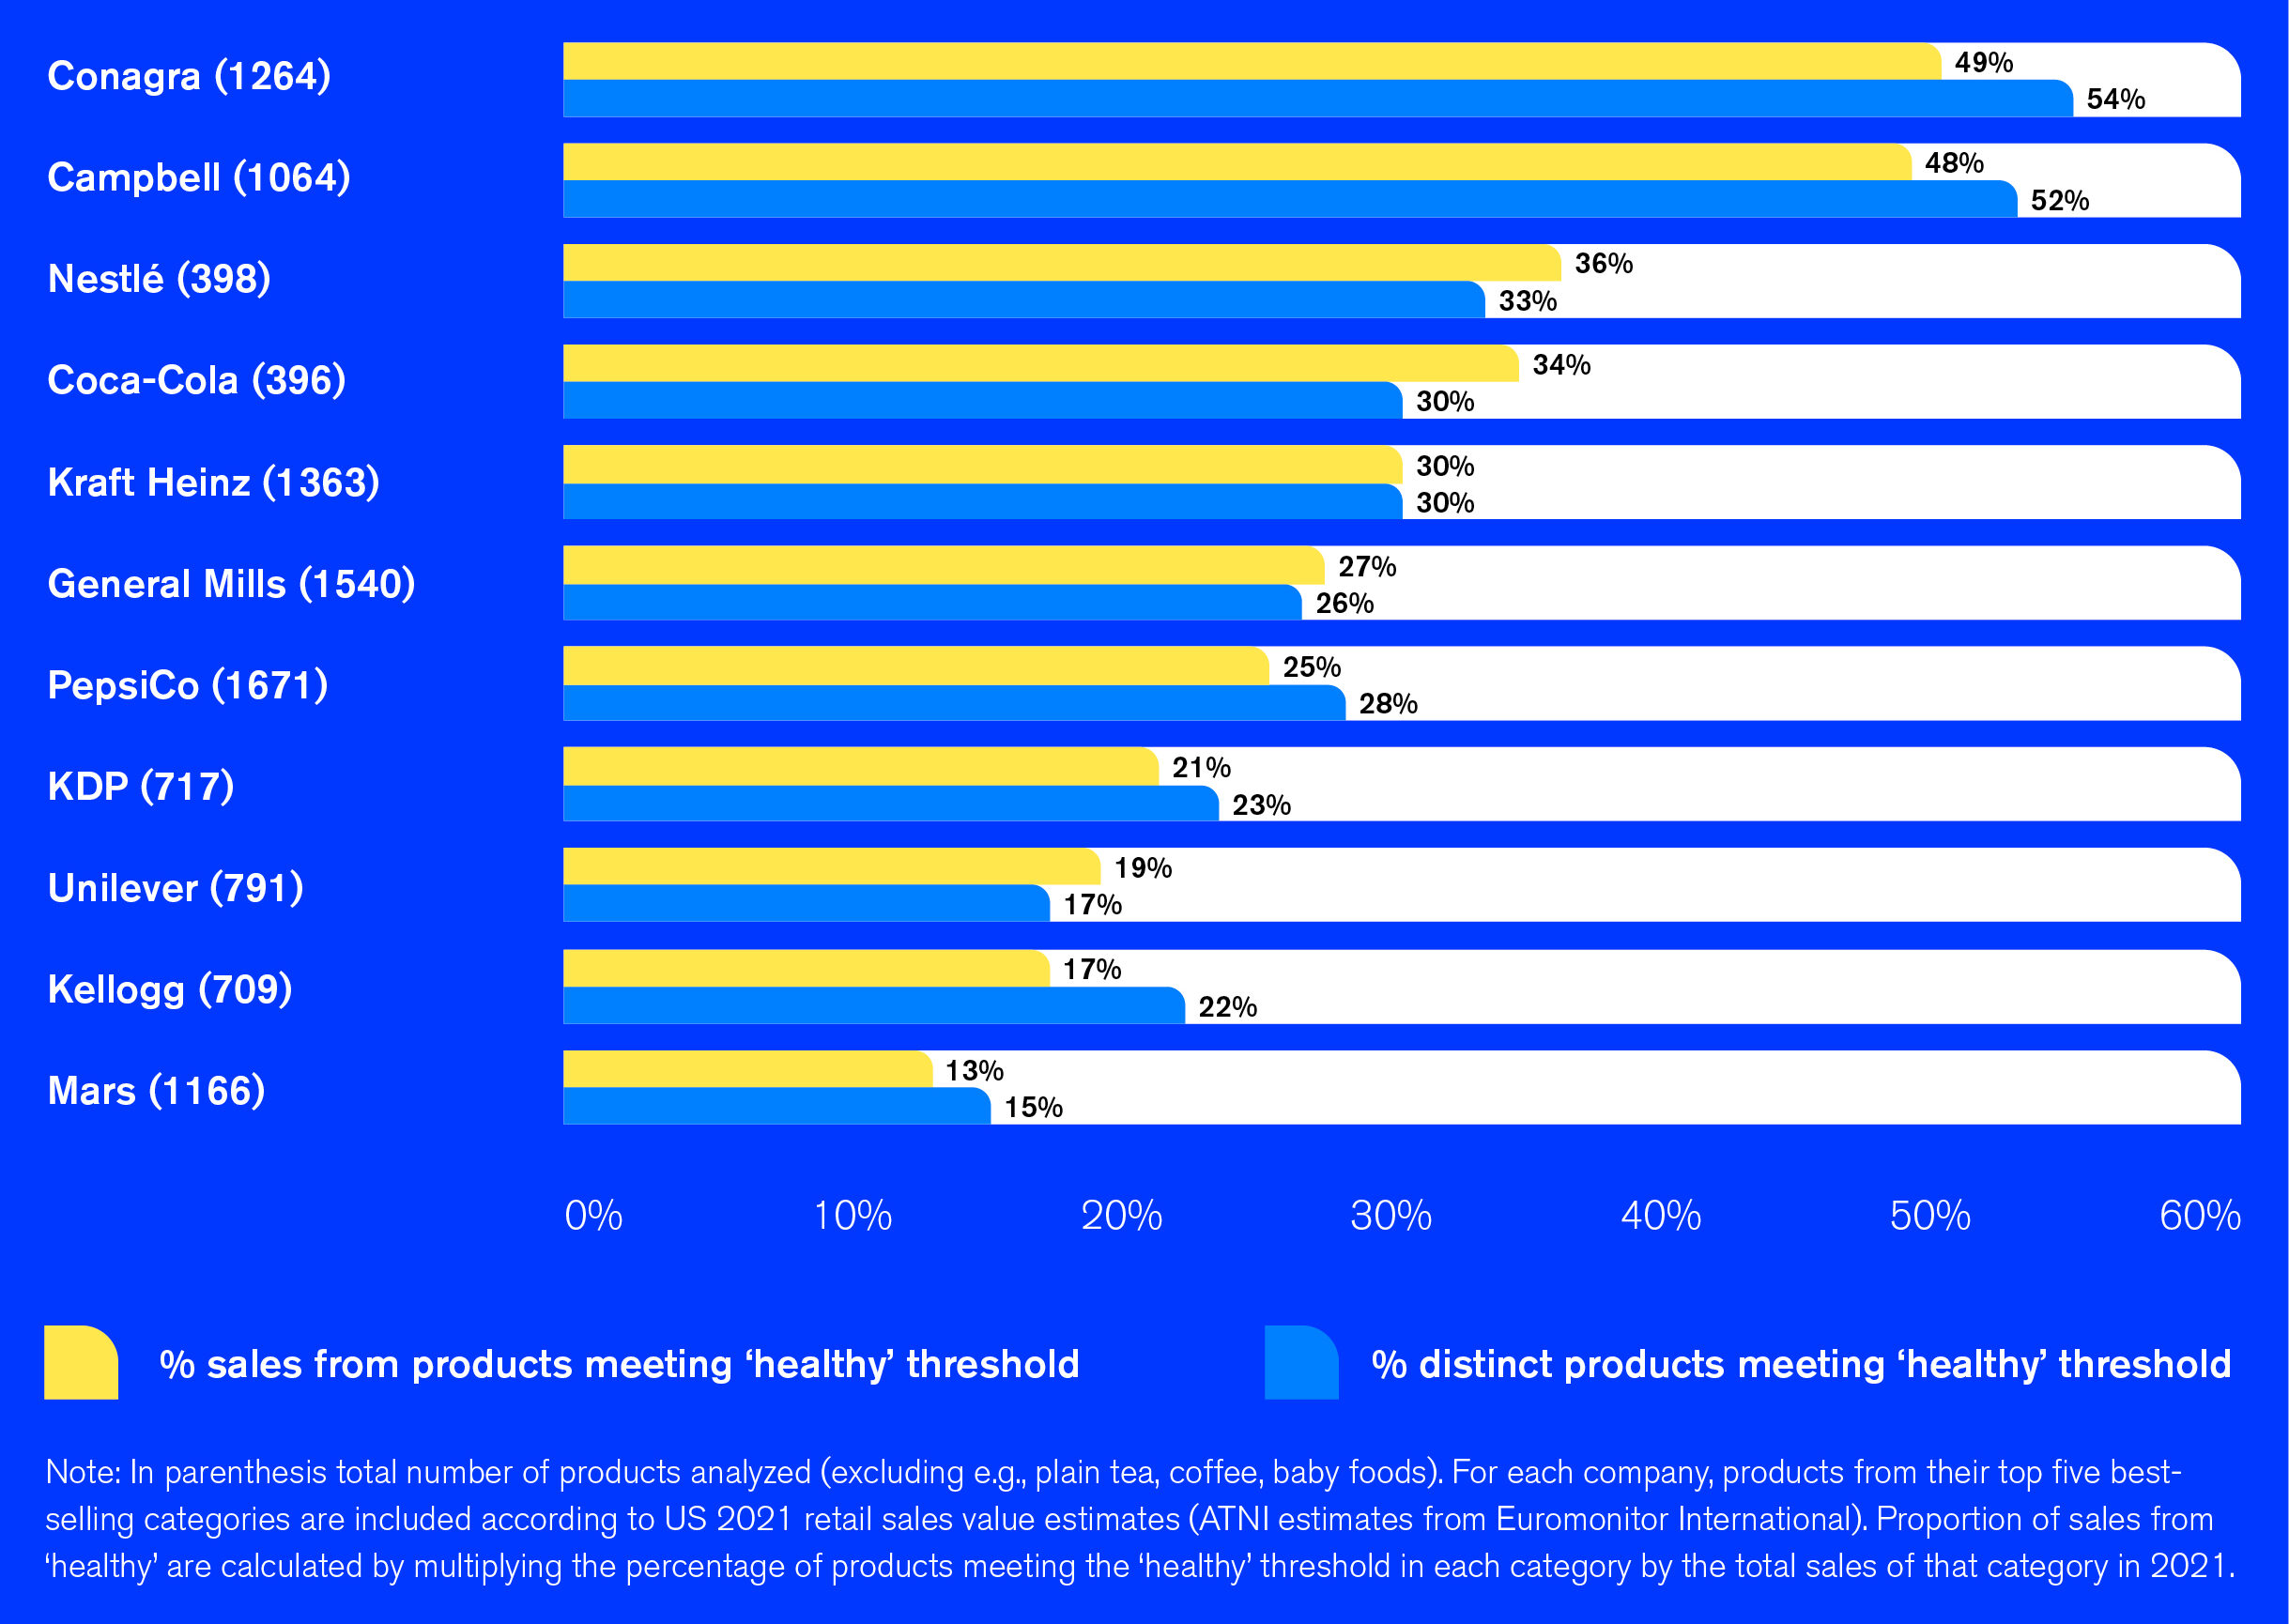
The ‘healthy’ threshold (having an HSR of 3.5 stars or more out of five) categorizes products into those that could be considered ‘healthy’ and those that do not meet the threshold. Figure 2 sees only two companies – Conagra and Campbell – had 50% or more of their distinct products meeting the ‘healthy’ threshold.
In terms of sales, no company was found to derive more than 50% of its sales from healthier products (HSR 3.5 or more). Four companies – Coca-Cola, General Mills, Nestlé, and Unilever – were found to derive a higher proportion of sales from healthier products, compared to the proportion of their distinct products that can be considered healthier, showing it is possible for companies to channel marketing resources to increase sales of healthier foods. Mars was found to have the lowest proportion of ‘healthy’ products, both before and after sales weighting was applied, due to confectionery items dominating its portfolio and sales.
These findings illustrate the opportunity for companies to increase the proportion of sales derived from healthy foods and decrease their reliance on sales of unhealthy foods. Apart from accelerating product (re)formulation, companies can achieve this by redirecting marketing to healthier products and brands, along with considering nutrition as part of merger & acquisition strategies.
Figure 2. Percentage of products meeting the ‘healthy’ threshold and sales from ‘healthy’ products
Detailed Product Profile results for each company, including category performance, can be found on the company scorecards. More information on the Product Profile is included in the TGI report.
To improve performance on the Product Profile, companies are encouraged to:
-
Give more priority to (re)formulation in their nutrition strategies, to improve the nutritional quality of their products and overall healthiness of portfolios. Companies can also accelerate progress by considering nutrition in their merger & acquisition decisions, e.g. by acquiring healthier brands, and discontinuing or reducing sales of less healthy food & beverage products.
-
Re-direct investments toward marketing healthier products or healthier categories to derive more US sales from healthier products.
- Consider the recommendations made in the following sections (related to criteria B2 and B3 of the ATNI methodology).
Box 3: What Is Assessed in the Product Profile?
ATNI compares the healthiness of companies’ product portfolios using the Australian HSR. The HSR examines the content of positive nutrients/components (fiber, protein, fruits, nuts, legumes, and vegetables) and nutrients of concern (energy, saturated fats, total sugars, and salt) within individual products (per 100ml or 100g), and assigns them a score between 0.5 and 5.0. ATNI uses the threshold of 3.5 stars or more to classify products as generally healthier.
To select the packaged foods and beverages for analysis, ATNI identified a maximum of five best-selling product categories for each company, based on their estimated US retail sales values in 2021 (). All products in these categories are assessed using the HSR.
The Product Profile assessment is undertaken in partnership with TGI, and follows the same methodology and principles applied according to the previous US Index in 2018.
Nutrient information was obtained either directly from the manufacturer, product packaging, as collated in packaged food & beverage databases, company websites, or in-store visits.
It is important to note that the Product Profile does not include non-nutrient-based measures of nutritional quality or other attributes of packaged foods, e.g. additives and level of processing. In addition, plain tea, plain coffee, baby foods, and other specialty products (e.g. supplements) are excluded from analysis.
For more information on the Product Profile methodology, access TGI’s report here.
B2. Product Formulation
The results of the Product Profile underscore that companies need to increase attention to their commitments to product formulation and innovation, in order to improve the nutritional quality of packaged foods and non-alcoholic beverages in the US.
Clear, transparent, and verifiable reporting on targets and progress made to increase sales of healthier products should be a core element of food companies’ annual reporting.
Table 2. Companies’ healthy* sales targets and disclosure
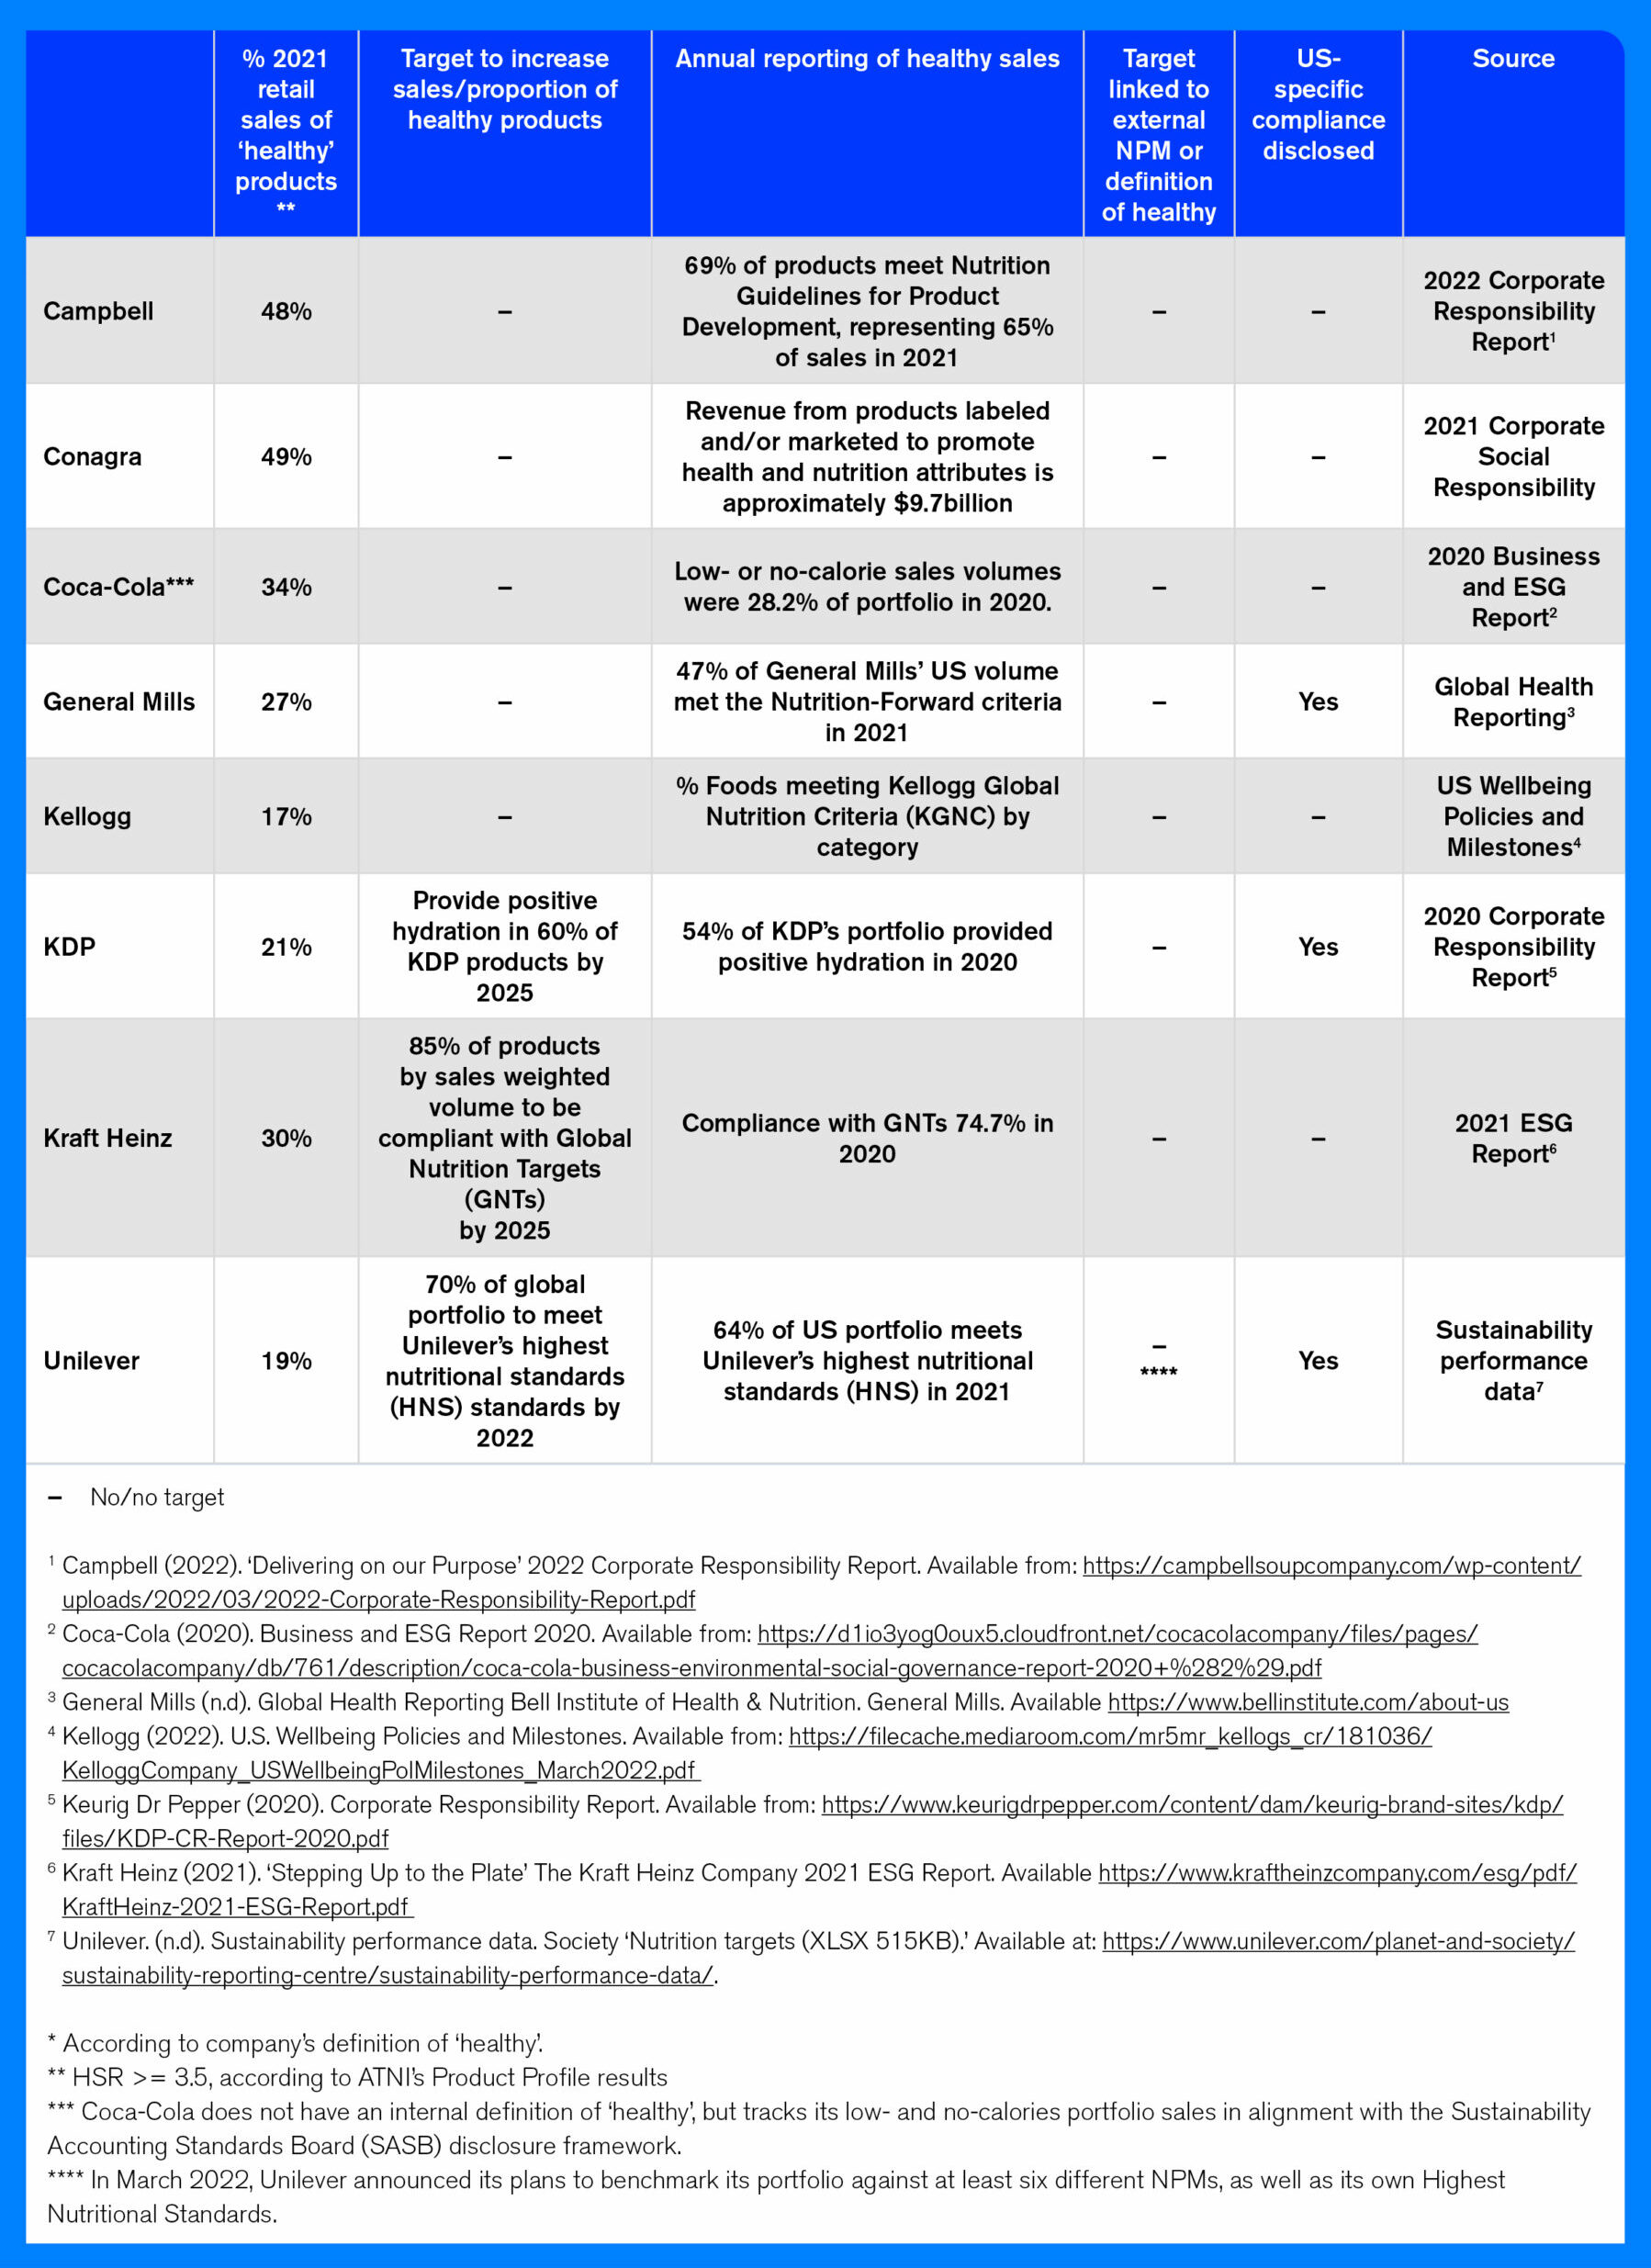
Only three companies – Keurig Dr Pepper, Kraft Heinz, and Unilever – were found to have set clear and time-bound targets to increase the sales/proportion of ‘healthy’ products globally, including in their US portfolios (see Table 2). Unilever and Kraft Heinz indicate their targets are linked to sales volumes. It is important to note that the three companies use their own definitions of ‘healthy’ (set of nutrition criteria or NPM). Keurig Dr Pepper works with Partnership for Healthier America (PHA) to independently verify progress against its goal.
Notable Example: Unilever is the only company that externally verifies its target to improve sales of healthier products. The company has appointed PricewaterhouseCoopers (PwC) to provide limited assurance of selected sustainability metrics. This is a notable development, as stakeholders are increasingly looking for accurate and reliable public metrics on nutrition. In 2021, 63% of Unilever’s global portfolio by sales volume was found to have met the company’s Highest Nutrition Standards (HNS) NPM. In addition, the company reports US-specific compliance (at 64% in 2021) on its global website under ‘Sustainability Performance Data.’ In March 2022, the company announced that, as of 2023, it will publicly report the performance of its product portfolio against at least six different government-endorsed NPMs as well as its own HNS.
Mars commits to 95% (or more) of its products meeting its nutrition criteria by 2025. However, this target only covers the company’s food segment, excluding Mars Wrigley products, which account for most of the company’s sales. In addition, no US-specific target or reporting was found.
As Table 2 shows, only two companies – General Mills and Unilever – disclose the proportion of ‘healthy’ sales for their US portfolio.
While many companies reference international and national dietary guidelines as part of their nutrition strategies, results show that five companies (Kellogg, KDP, Mars, PepsiCo, and Unilever) made explicit references to the latest edition of the US Dietary Guidelines for Americans, 2020–2025 and/or the recommendations that target US-specific nutrition concerns. Companies refer to these guidelines either on their websites, in nutrition strategies, or NPMs. For example, in the Mars Food Nutrition Criteria, the company defines a single serving of wholegrains as 16g dry making reference to the Dietary Guidelines for Americans, 2020–2025 and the Health Grain Forum.
Table 3. Overview of product (re)formulation targets
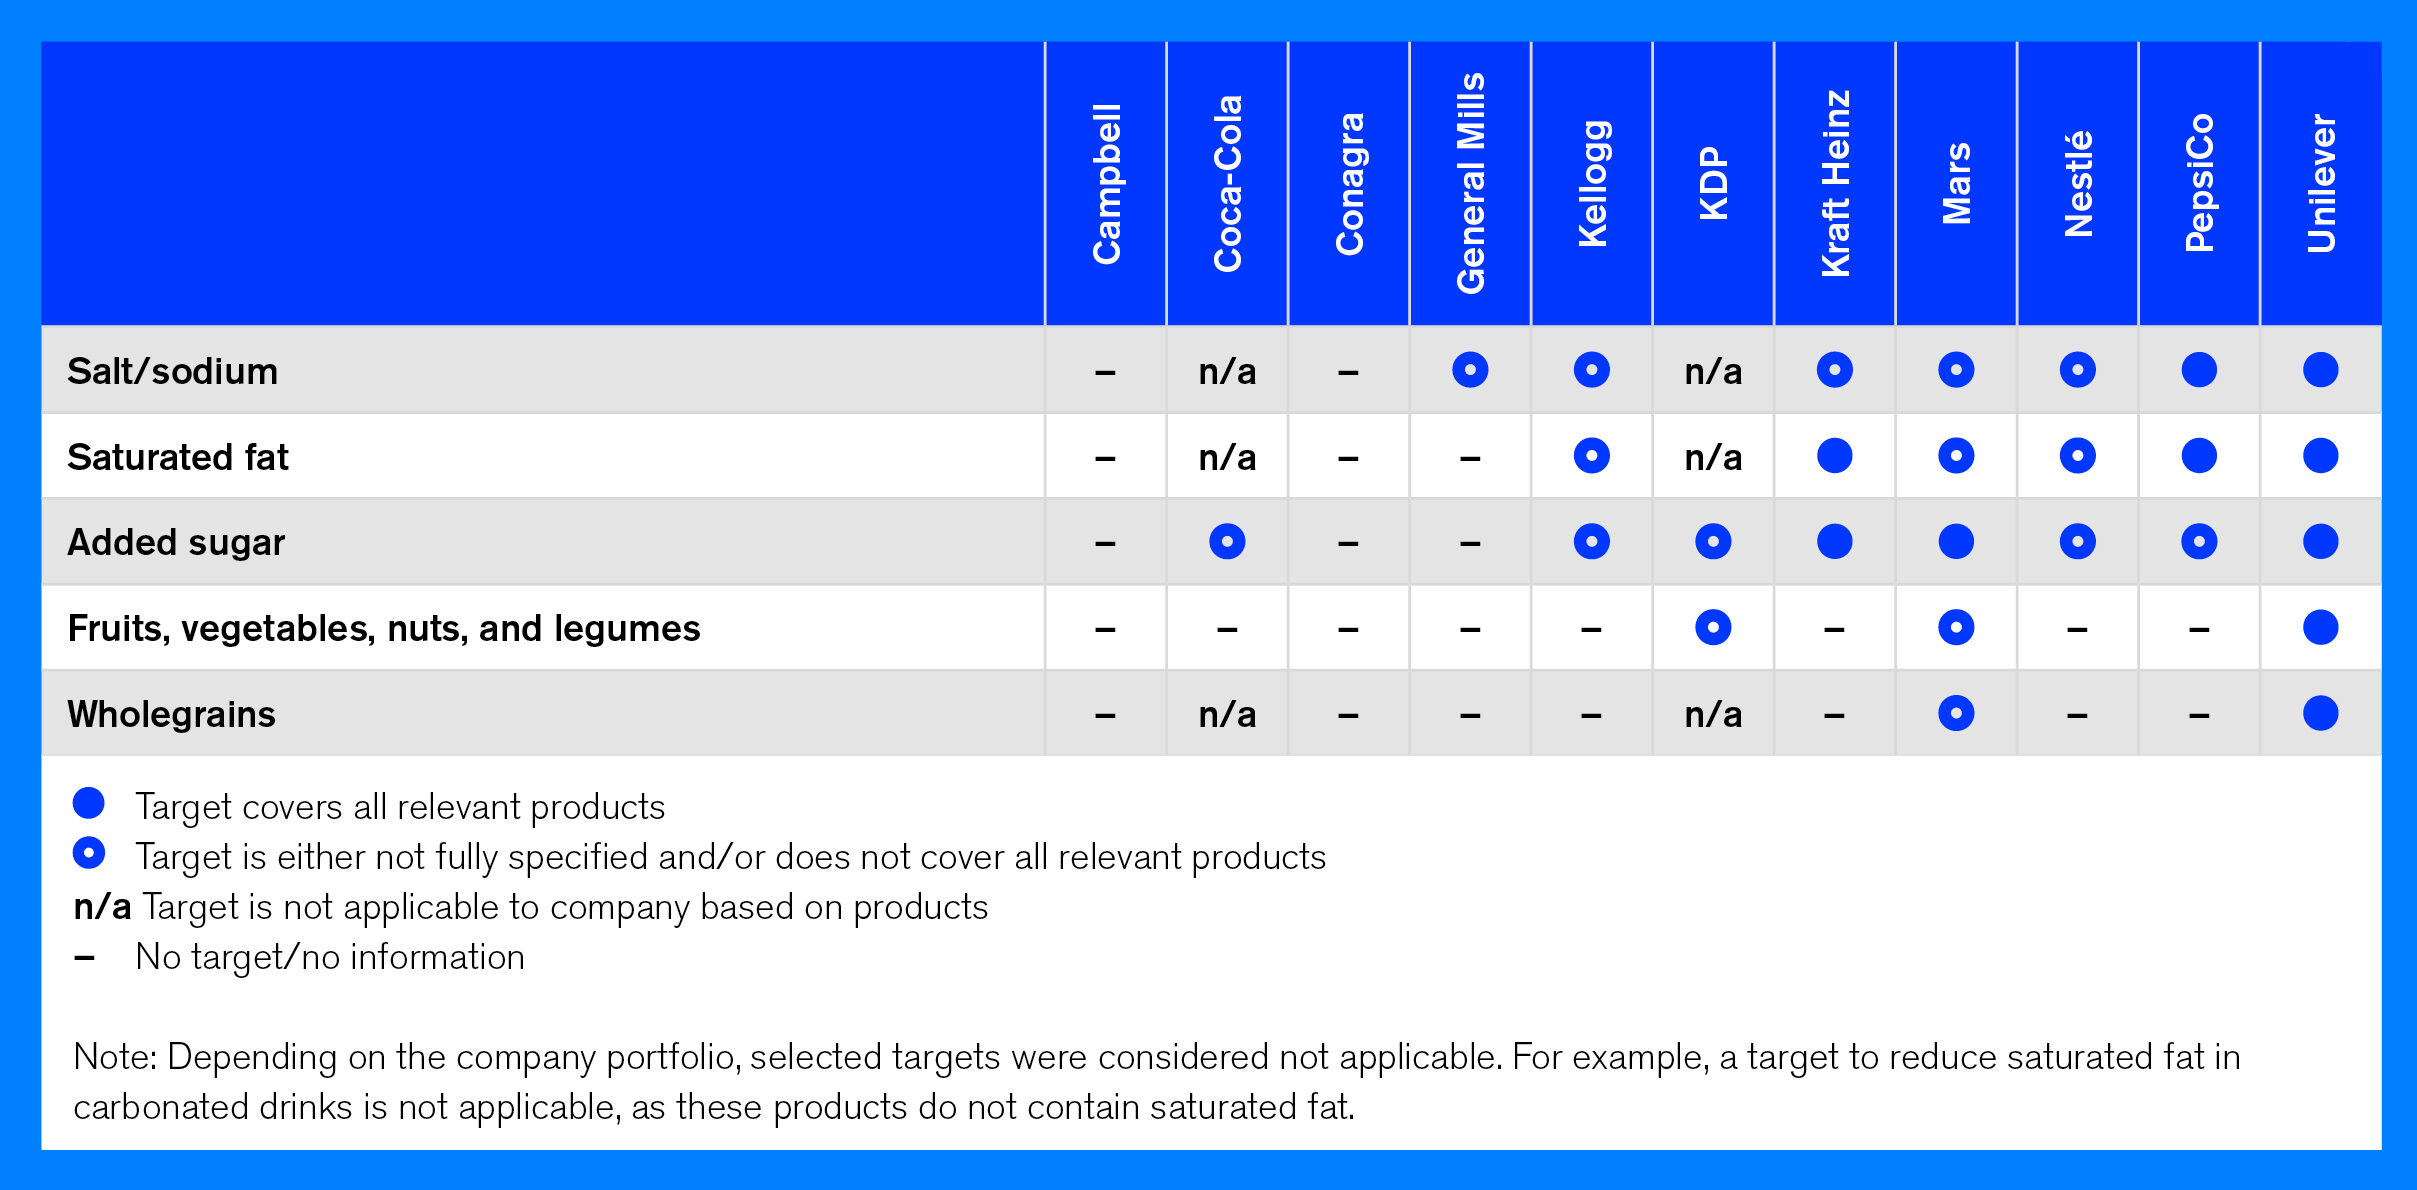
Overall, Index results show that companies continue to adopt company-specific targets, without specifically referring to externally verifiable benchmarks or standards – which limits the ability to compare progress over time. ATNI encourages companies to review their targets in alignment with external benchmarks to ensure that reductions of nutrients of concern and higher amounts of positive nutrients and ingredients result in meaningful public health impact. Table 3 shows that most companies have targets in place to reduce nutrients of concern (e.g. sodium, saturated fat, added sugar), but only a few have targets to increase positive nutrients or ingredients (e.g. fruits, vegetables, nuts and legumes, and wholegrains). For sodium and added sugars, most companies were found to have targets in place. Campbell and Conagra are the only companies found to have no nutrient or food component-specific (re)formulation targets.
Sodium
-
PepsiCo and Unilever are the only companies to adopt a sodium target that is aligned with FDA guidance for all relevant categories in their portfolios.
- As part of its new Compass strategy, Unilever has defined the ambition to have 85% of its food portfolio “help consumers reduce their salt intake to no more than 5g per day by 2022.” However, this target is not easy to verify externally, and it’s unclear how acceptable sodium levels link to the company’s HNS. On its global website, under ‘Sustainability performance data,’ Unilever publishes progress by country. For the US, 87% of its portfolio was reported to have met the salt target in 2020 (up from 83% in 2019).
- One company was found to be currently undertaking an internal evaluation on how its best-selling products across all relevant categories in the US portfolio perform against the voluntary FDA sodium standards.
- In 2021, PepsiCo announced its new sustainability strategy, Pep+, which includes a commitment to accelerating its reduction of added sugars and sodium through the use of science-based targets across its portfolio, and cooking its food offerings with healthier oils. The company has the ambition for at least 75% of its foods portfolio volume not to exceed 1.3mg of sodium per calorie by 2025. However, the company did not disclose compliance against this target for the US market.
Saturated fat
-
Only three companies – Unilever, Kraft Heinz, and PepsiCo – were found to have saturated fat reduction targets in place that are applicable to all relevant products in their portfolios. Only PepsiCo has a specific saturated fat target that is time-bound (by 2025, at least three-quarters of its global foods portfolio sales volume will not exceed 1.1g of saturated fat per 100 calories). PepsiCo works together with Partnership for Healthier America (PHA) to serve as an independent verifier of its commitments to reduce added sugar in the beverage portfolio, along with sodium and saturated fats in its foods portfolio.
-
Mars and Kellogg commit to reducing saturated fat levels. However, their commitments do not extend to all relevant products. For example, Kellogg commits to saturated fat levels of less than 5g per 100g by 2025. However, the company limits this commitment, covering only its foods marketed to children. Mars has relevant saturated fat criteria, but this is only applicable to its food segment.
- In its 2020 Creating Shared Value report, Nestlé states that its target to reduce saturated fat by 10% in all relevant products that do not meet the Nestlé Nutritional Foundation (NF) criteria with respect to saturated fat has been achieved. However, no new target for saturated fat was reported.
Sugar
-
Mars, Kraft Heinz and Unilever are the only companies that have adopted sugar target(s) for all relevant product categories.
-
Mars Food Nutrition Criteria, third edition, 2021, states that, by 2025, 95% of its products will meet strict nutrition standards for energy, sodium, added sugar, saturated, and total fat. Mars Wrigley has committed, in alignment with PHA, to using ≤25g sugar/portion as its guidepost for all new products, beginning with innovation in 2020 for chocolate and 2023 for fruity confections.
- Of the three beverage companies that started the Beverage Calories Initiative (BCI, see Box 5) in 2014, PepsiCo is the only company found to disclose, on its own website, a company-specific commitment to reducing calories from added sugars in its global portfolio, including the US. By 2025, the company wants 67% or more of its beverage portfolio volume to have 100 calories or less from added sugars per 12oz serving. According to PepsiCo, by the end of 2020, 48% of its beverage sales volume in its top 26 global markets was in line with this goal. To improve transparency, companies that are part of the BCI are encouraged to disclose company-specific progress on their calorie reduction programs and publish updated data on their own websites.
Positive Nutrients and Ingredients
-
Only three out of the 11 companies assessed – KDP, Mars, and Unilever – were found to have a target in place to increase the levels of fruits, vegetables, nuts, or legumes in their products. In the US Index 2018, only one company was found to have a positive nutrients/ingredients target. In 2022, Unilever disclosed a relevant target for all product categories. As part of its new Compass Future Foods commitments, Unilever strives to double the number of products sold that deliver ‘Positive Nutrition.’ The company defines this as products containing impactful amounts of vegetables, fruits, proteins, fiber, unsaturated fatty acids, or micronutrients such as vitamins, zinc, iron, and iodine.
-
Unilever and Mars disclosed a target to increase levels of wholegrains. In its updated Food Nutrition Criteria, Mars states: “At the start of 2021, we set ourselves a new challenge of delivering 5.5 billion healthy meals by 2025. We will do this through delivering 4 billion servings of vegetables, a 30% increase of fiber servings in our products, and a 5% reduction of sodium in our portfolio by 2025.” As part of its association with PHA, Mars has committed to expanding wholegrain options in the US, so that at least half of all grain products in the Mars US Food product portfolio include a minimum of 16g of wholegrains per serving and may include legumes.
- Other companies have general commitments to increasing the use of positive nutrients or ingredients, but did not specify a time-bound target. For example, PepsiCo’s Pep+ strategy explicitly states that the company will use more legumes, wholegrains, plant-based proteins, fruits and vegetables, nuts and seeds, and diverse ingredients.
Evidence as to the impact of portion control on the part of consumers and smaller packaging sizes on public health remains limited. Therefore, this is an unscored indicator in ATNI’s methodology (i.e. for information purposes only). Many companies offer smaller serving sizes and a variety of packaging options. Little evidence was found of companies adopting comprehensive programs or conducting research to explore how these efforts have led to improved consumer portion control in the US. Recognizing the need to support education campaigns and market research, a few of the Index companies support the multi-stakeholder platform Portion Balance Coalition. More information about this initiative can be found in Chapter G on Lobbying.
In the last three years, eight companies were found to be developing products with smaller packaging or serving sizes across multiple categories or brands. Examples vary from mini-cans of carbonated drinks to smaller portions of single-serve snacks. Two companies provided relevant examples, but only across one product category (e.g. confectionery) or for one brand.
To improve the healthiness of their portfolios, companies are encouraged to:
-
Evaluate the overall healthiness of their US product portfolios according to ATNIs methodology. And define concrete and time-bound targets to increase sales of ‘healthy’ products. Companies are recommended to report progress on delivering against their ‘healthy’ sales target on an annual basis, and to make this information easily accessible on the company’s US-specific website or in reports. ATNI encourages companies to couple financial growth targets with higher sales of healthier products.
-
Set targets to reduce nutrients of concern and increase positive nutrients/ingredients in their products. Targets should apply to the entire US product portfolio (where relevant), and companies report on progress over time. Targets should be aligned with national recommendations or standards (e.g. FDA voluntary sodium reduction targets) and, when those are not available, to international standards (e.g. WHO).
-
Demonstrate that new product development and product reformulation efforts are aligned with the Dietary Guidelines for Americans, 2020–2025.
- Ensure that all products sold under the Smart Snacks in School regulation and their identical counterparts sold in retail meet the same nutrition standards.
Box 4: Smart snacks in school
The US Department of Agriculture’s (USDA) Smart Snacks in School standard is a federal standard that applies to all snacks and beverages sold , in school stores, vending machines, and other venues where food is sold to students. Nutrition experts have raised concerns that, while products supplied to schools meet the Smart Snacks in School nutrition standard, equivalent and identical products with the same look and feel, sold in retail and other outlets, might not. Such products are referred to as ‘copycat’ or ‘lookalike’ products.
The US Index in 2018 found that only two companies provided evidence of formulating all products in the Smart Snacks program in the same way, irrespective of the distribution channel. In 2022, six companies stated that either they don’t participate in the program (Unilever, Conagra, and Nestlé), or they already formulate all products in the same way (Coca-Cola, Kellogg, and PepsiCo). Kellogg is the only company that makes a public and specific reference to this topic in its US Wellbeing Policies and Milestones 2022 report, stating: “In 2021, 16% of our K-12 Smart Snack portfolio was sold in other sectors of away-from-home channels. Any of our foods that deliver against Smart Snacks standards are also sold outside of schools in channels such as vending and retail.”
Box 5: Beverage Calories Initiative
To help fight obesity, in 2014, companies in the American Beverage Association – Coca-Cola, KDP, and PepsiCo – together with the Alliance for a Healthier Generation, agreed to a multi-year effort to reduce beverage calories consumed per person nationally by 20% by 2025. Named BCI, according to the latest evaluation of the program, calories per person have decreased 10% since its launch.
B3. Nutrient Profiling Model (NPM): Defining ‘Healthy’ Products
All companies (as shown in table 4) except Coca-Cola have adopted an NPM or other nutrition criteria to guide their product (re)formulation strategies.
Table 4. Characteristics of companies’ nutrition criteria, NPMs
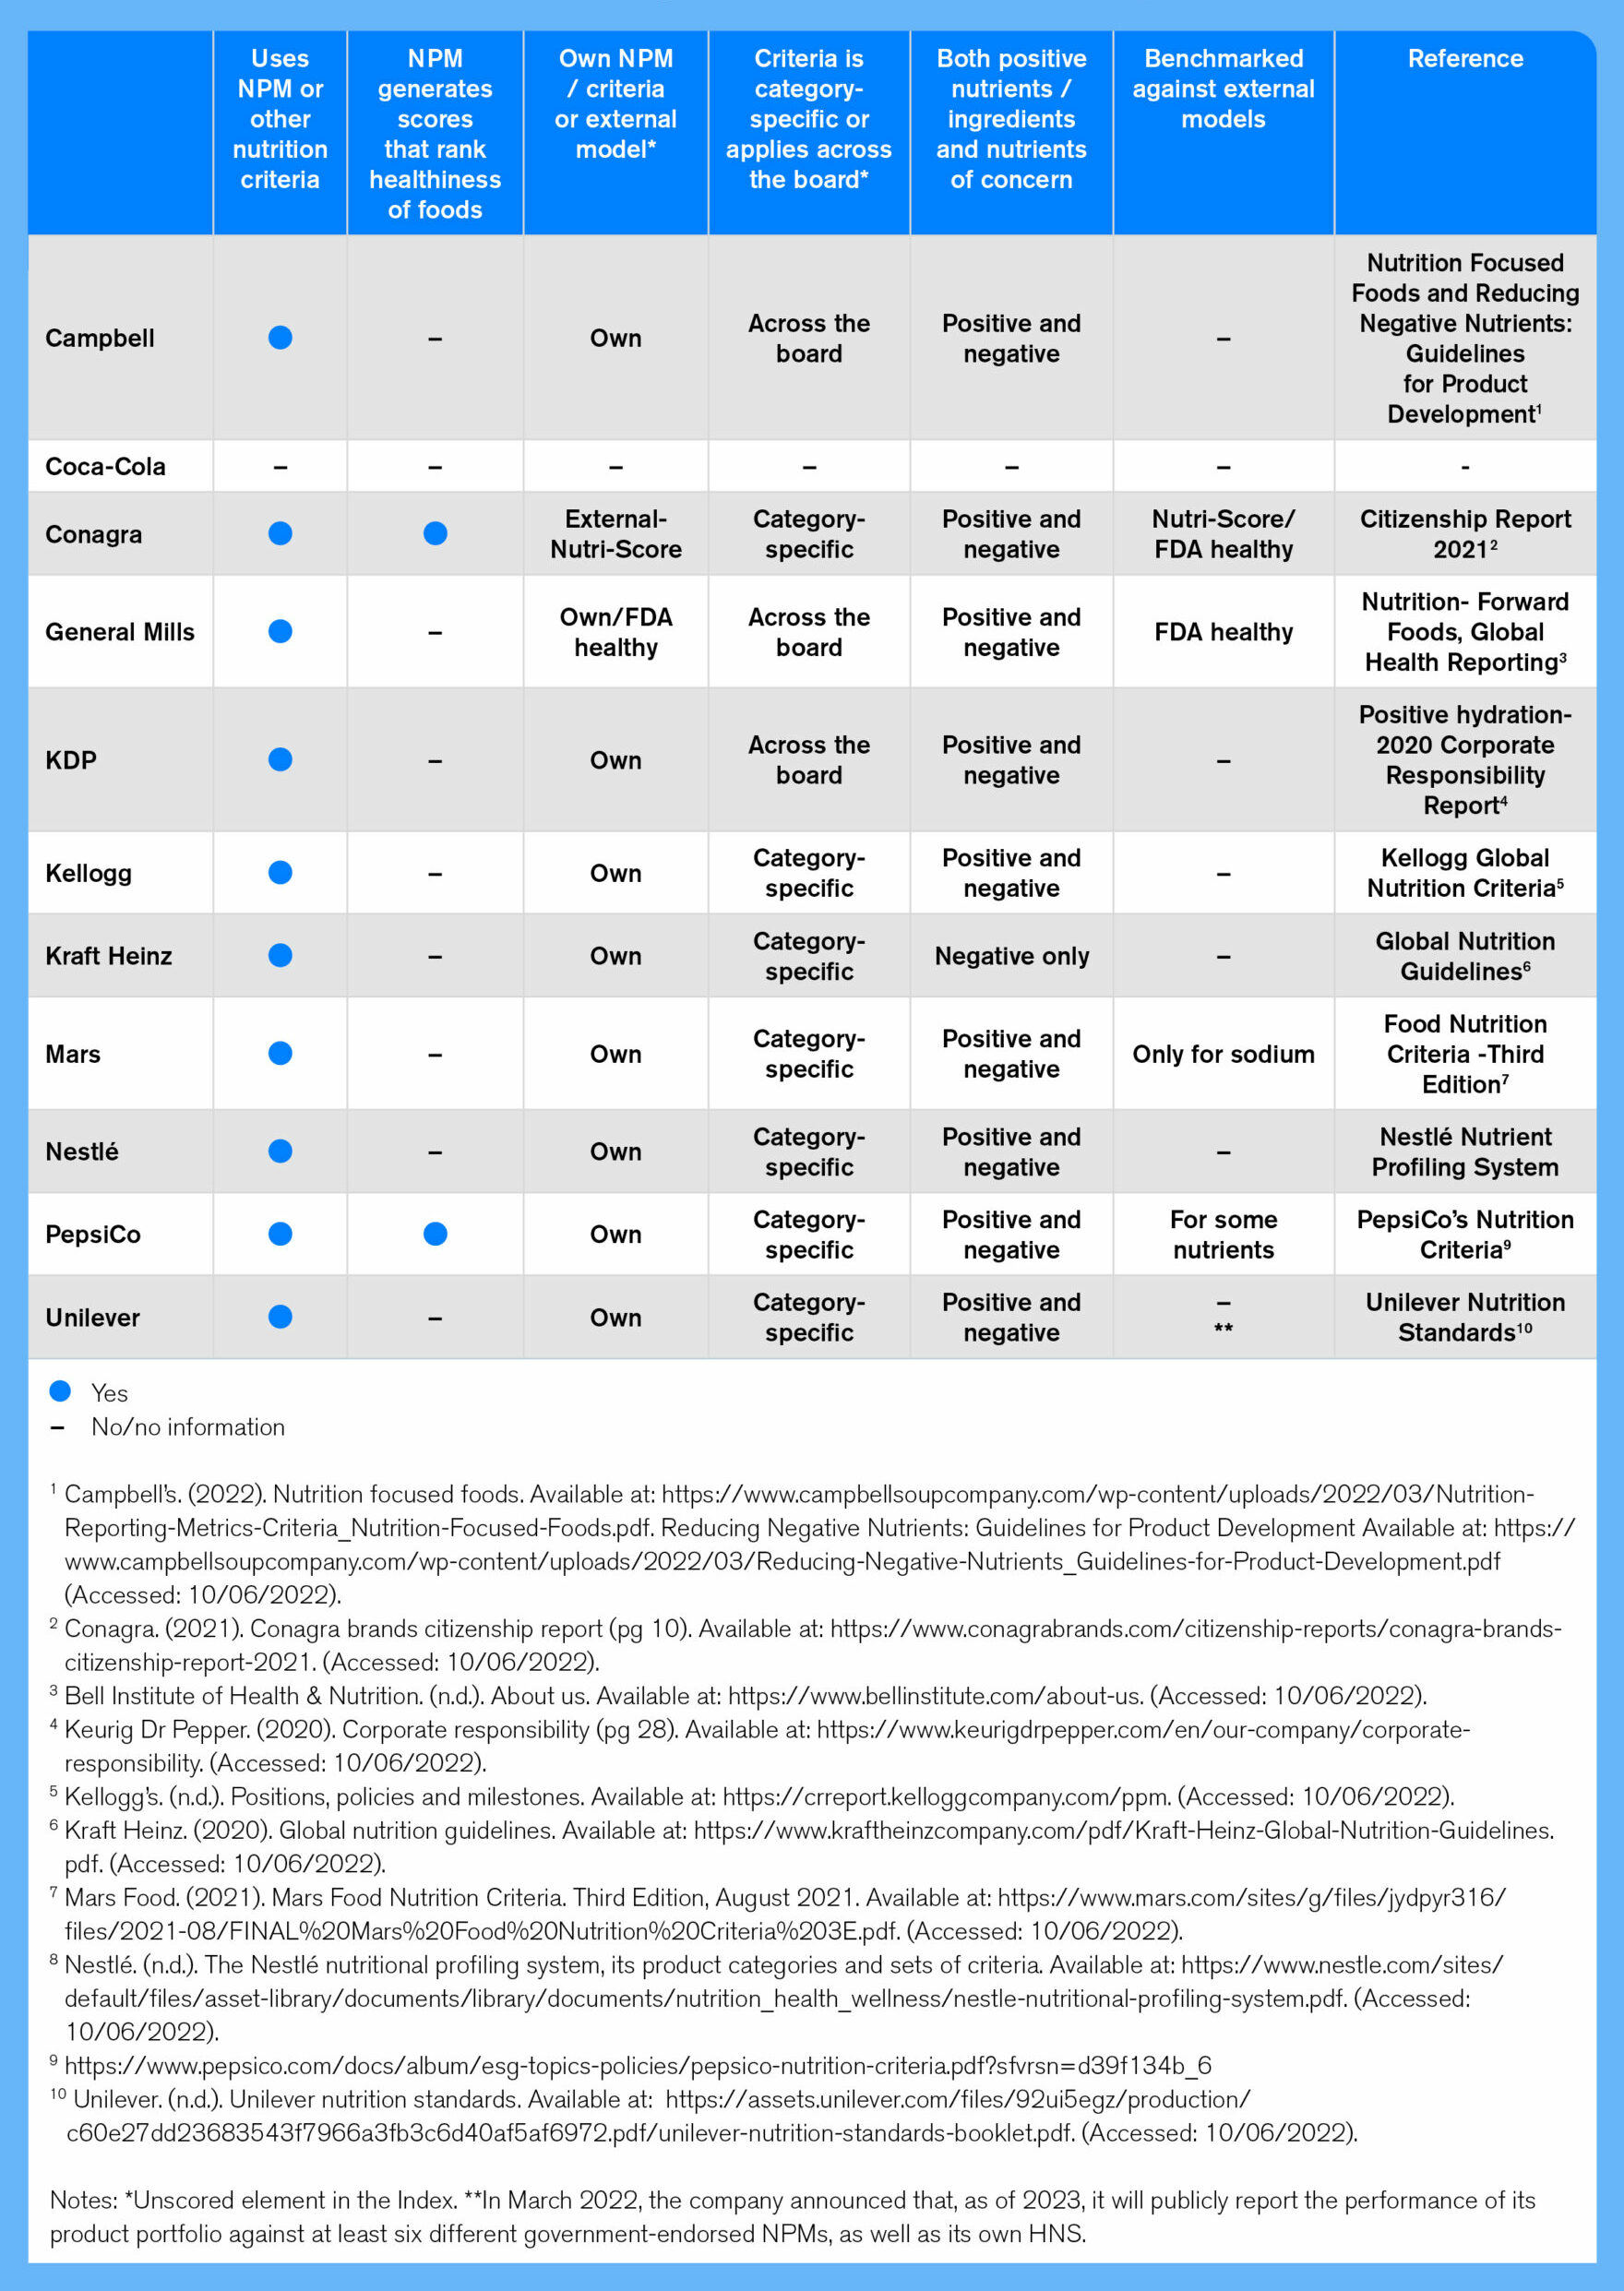
In addition, these criteria can be used to evaluate the healthiness of entire portfolios. This is critical, as more transparency and demand for setting healthy targets arise. Table 4 also shows that most companies have category-specific NPMs, which means nutrient or ingredients thresholds vary by product type.
Another positive development is that most companies are considering both positive nutrients and ingredients in their models, as well as nutrients of concern. In 2018, only four companies were found to do so (General Mills, Mars, Nestlé, and PepsiCo).
It is important to note that the assessment of companies’ NPMs is based on the design principles, not on an in-depth assessment of the nutrition criteria embedded within them.
Notable Example: In its 2021 Citizenship report, Conagra describes the introduction of a new metric, ‘Sustainable Nutrition,’ as measured by NutriScore A or B for vegan and vegetarian products. According to the company, 82% of its vegan and vegetarian meals and meat replacements currently qualify for this attribute. In addition, the company applies the FDA Healthy criteria to its Healthy Choice products. However, as the company does not formally publish how it uses these NPMs (FDA/Nutri-Score), it is unclear as to which products in Conagra’s US portfolio are revised or developed considering these criteria.
Despite important developments in the adoption of NPMs, only a few companies publish full details on the use of their NPMs. Nestlé, PepsiCo, and Unilever publish details of their NPMs in peer-reviewed journals. Conagra also uses a validated and government-endorsed NPM, Nutri-Score.
So far, no company has publicly disclosed the results of applying their own criteria/NPM against the results of applying an internationally recognized NPM to their portfolio.
While ATNI welcomes the development and application of evidence-based NPMs to guide companies’ (re)formulation strategies, varied definitions of ‘healthy’ products and other criteria are being used, which limits efforts by external stakeholders to monitor and compare companies’ progress over time.
Notable Example: PepsiCo published its NPM in a peer-reviewed journal article. The article presents PepsiCo Nutrition Criteria (PNC), a new internal NPM that was designed to guide and monitor improvements in nutrient density and overall nutritional quality of foods and beverages. The new PNC NPM assigns food products into four classes of increasing nutritional value, based on the content of nutrients to limit, along with nutrients and ingredients to encourage. The nutrient standards used for category assignment follow those developed by global dietary authorities. Standards are proposed for calories, sodium, added sugars, saturated, and industrially produced trans fats. In the article, the company provides examples of recently reformulated products according to these guidelines.
In March 2022, Unilever announced that, as of 2023, it would publicly report the performance of its product portfolio against at least six different government-endorsed NPMs, as well as its own HNS.
Apart from using company-specific NPMs, there is evidence that some manufacturers might make use of existing government programs’ nutrition criteria to develop healthier products. For example, Campbell reports that 71% of Campbell Soup’s meals and beverages meet the requirements for at least one federal nutrition program, including WIC Eligible Foods, SNAP Staple Foods for Retailer Eligibility and USDA Smart Snacks. More transparency on how companies use different nutrition criteria for their product (re)formulation strategies is required.
To increase the sales from healthier products and accelerate product (re)formulation strategies, companies are encouraged to:
-
Benchmark their definition of ‘healthy’ and/or full NPMs against externally validated and preferably internationally recognized (and, where applicable, government-endorsed) – like the planned FDA standard on the criteria to use the term ‘healthy’ as a nutrient content claim. This is critical to ensuring companies’ (re)formulation strategies focus on the overall nutritional quality of products rather than on individual nutrients, and that they align with public health priorities and recommendations set out by the Dietary Guidelines for Americans, 2020–2025. To support this, all companies are recommended to consider reviewing how the Product Profile results compare to their own estimates.
-
Disclose full details of their NPM on their websites, including scores, criteria, and how and for what purposes the criteria are applied. If companies have developed their own NPM, this should be evidence-based and preferably published in a peer-reviewed scientific journal.
- Ensure the NPM covers the entire product portfolio and conduct regular evaluations to ensure the criteria used are aligned with the most updated scientific evidence and available standards, e.g. to the FDA voluntary sodium reduction guidelines.
Box 6: Methodology - healthy multiplier results
In the US Index 2022 methodology, a healthy multiplier is applied to any scores for commitment, performance or disclosure indicators relating to ‘healthy’ products. The multiplier is derived from the company’s score on Criterion B3: ‘Nutrient Profiling Model (NPM): defining ‘healthy’ products, and ranges from 0.4 (i.e., reducing the score of a relevant indicator) to 1 (i.e., no effect on the score of a relevant indicator).
Companies’ ‘healthy’ multiplier results:
- 1.0 (PepsiCo)
- 0.8 (Conagra, General Mills, Nestlé and Unilever)
- 0.6 (Campbell, Kellogg, KDP, Mars, Kraft Heinz)
- 0.4 (Coca-Cola)
PepsiCo is the only company that achieves a score of 8 points or more (out of 10) in criterion B3, thereby receiving a healthy multiplier of 1.0. This is linked to the fact that the company’s NPM – PepsiCo Nutrition Criteria – was designed to be inclusive of its whole portfolio, includes both nutrients of concern and positive nutrients, and consist of a scoring system which allows foods to be ranked or classified based on their healthiness. For other companies with no NPMs (Coca-Cola) or less comprehensive models and lack of transparency, a healthy multiplier is applied impacting indicators in the methodology that refer to ‘healthy’ products.
The ‘healthy’ multiplier results for the US Index might differ from the Global Index 2021 due changes in methodology and different thresholds used to derive the multiplier.