Labeling
Product labeling and use of health and nutrition claims
Category F consists of one criterion:
- F1 Product Labeling
To perform well in this category, companies should:
- Commit to using an interpretive front-of-pack (FOP) labeling system to assist consumers in making informed choices.
- Provide data to show that more than 80% of products display FOP nutrition labeling which shows, at minimum, % Daily Value (or similar measure) of selected nutrients.
- Display online nutrition information for products sold online to an equal or greater extent than that found on the physical product.
- If using on-pack images or making a claim on fruit and vegetable content, accurately display the amounts of fruits and vegetables contained in the product.
- On product labels, state the percentage of grains in the product that are wholegrains, where relevant.
Ranking
Category Context
Research shows that FOP nutrition labeling on products plays a role in consumer choice – particularly when consumers are comparing the relative healthiness of products. A FOP labeling system is considered to be more effective in helping consumers understand the healthiness of a product when it involves an ‘interpretive’ element, such as color-codes or symbols indicating whether a product scores “good” or “bad” on either individual nutrient criteria or summary criteria (such as NutriScore or Health Star Rating). Interpretive labels make it easier for consumers to quickly and easily comprehend a product’s contribution to a healthy diet without requiring specific or sophisticated nutritional knowledge. The World Health Organization (WHO) recommends interpretive FOP labeling as a key policy strategy to support healthier food choices and to encourage product reformulation. Ideally, FOP labeling systems should be standardized across a market, in order to avoid causing further confusion for consumers. Many different interpretive labeling systems have been developed, some of which are endorsed (and sometimes required) by other governments around the world.
Back-of-pack (BOP) nutrition labeling, and health and nutrition claims are regulated in the US by the Food and Drug Administration (FDA) and USDA. In 2016, the FDA updated the mandatory BOP nutrition labelling format known as the Nutrition Facts label.
However, there are currently no requirements for FOP labeling in the US. That said, the National Strategy launched by the US Government in September 2022 includes a commitment to develop a standardized FOP label, although it is unclear at this point in time what the content of this label will include, whether it will be mandatory or voluntary, and when it will be released. In addition, the FDA will soon release an updated version of the definition of ‘healthy’ and criteria for the use of the term ‘healthy’ in nutrient content claims on food labels in the US.
In lieu of regulation, some US companies use a voluntary FOP labeling system called ‘Facts Up Front,’ developed in 2012 through a joint initiative of the Consumer Brands Association (formerly the Grocery Manufacturers Association) and the Food Marketing Institute. The format presents the information using numerical information only, as shown in Figure 1, which involves only a limited degree of interpretive assistance. An example of a voluntary interpretive labeling system used in parts of the US is the ‘Guiding Stars’ labeling scheme, developed in 2008 to help consumers easily choose the most nutritious foods.
Figure 1. The ‘Facts Up Front’ label format

The COVID-19 pandemic has caused an acceleration in the trend toward online purchasing of food groceries. New research has found that the quality of provision of nutrition information for online products has significantly lagged behind in this trend; manufacturers and retailers have a responsibility to ensure nutrition information is easily accessible online. An interesting tool to assist in this regard is the SmartLabel: developed in the US by the Consumer Brands Association in 2015, this is an online system that enables consumers to access nutrition information in a standardized format.
Beyond FOP labeling, research shows that consumers often lack adequate understanding of wholegrain claims and how they contribute to the healthiness of a product. The Dietary Guidelines for Americans recommend that half of the daily grain intake should be wholegrains, yet Americans are currently failing to achieve this target in their diets. Food companies can support consumers by labeling which proportion of the grains in products are whole. A carbohydrate-to-fiber ratio of less than 10:1 is one of the criteria used by the USDA to identify whole grains in a food product; a study by researchers at the Harvard School of Public Health found this to be the most effective measure of healthfulness of whole grain products. Calculating the carbohydrate-to-fiber ratio may be difficult and not readily available for a consumer reading a label; therefore, labeling guidelines on wholegrain foods should be further improved.
Notable Examples
-
- F
Nestlé has been developing a ‘GRAINSMART balance’ system (in collaboration with Tufts University and other experts), whereby products with carbohydrates, fibers, and sugars that do not exceed a ratio of 10:1:2 can place a logo on-pack – thereby seeking to limit the amount of sugars and increase fiber content in such products.
F1. Product Labeling
Table 1. Companies’ provision of FOP information in the US
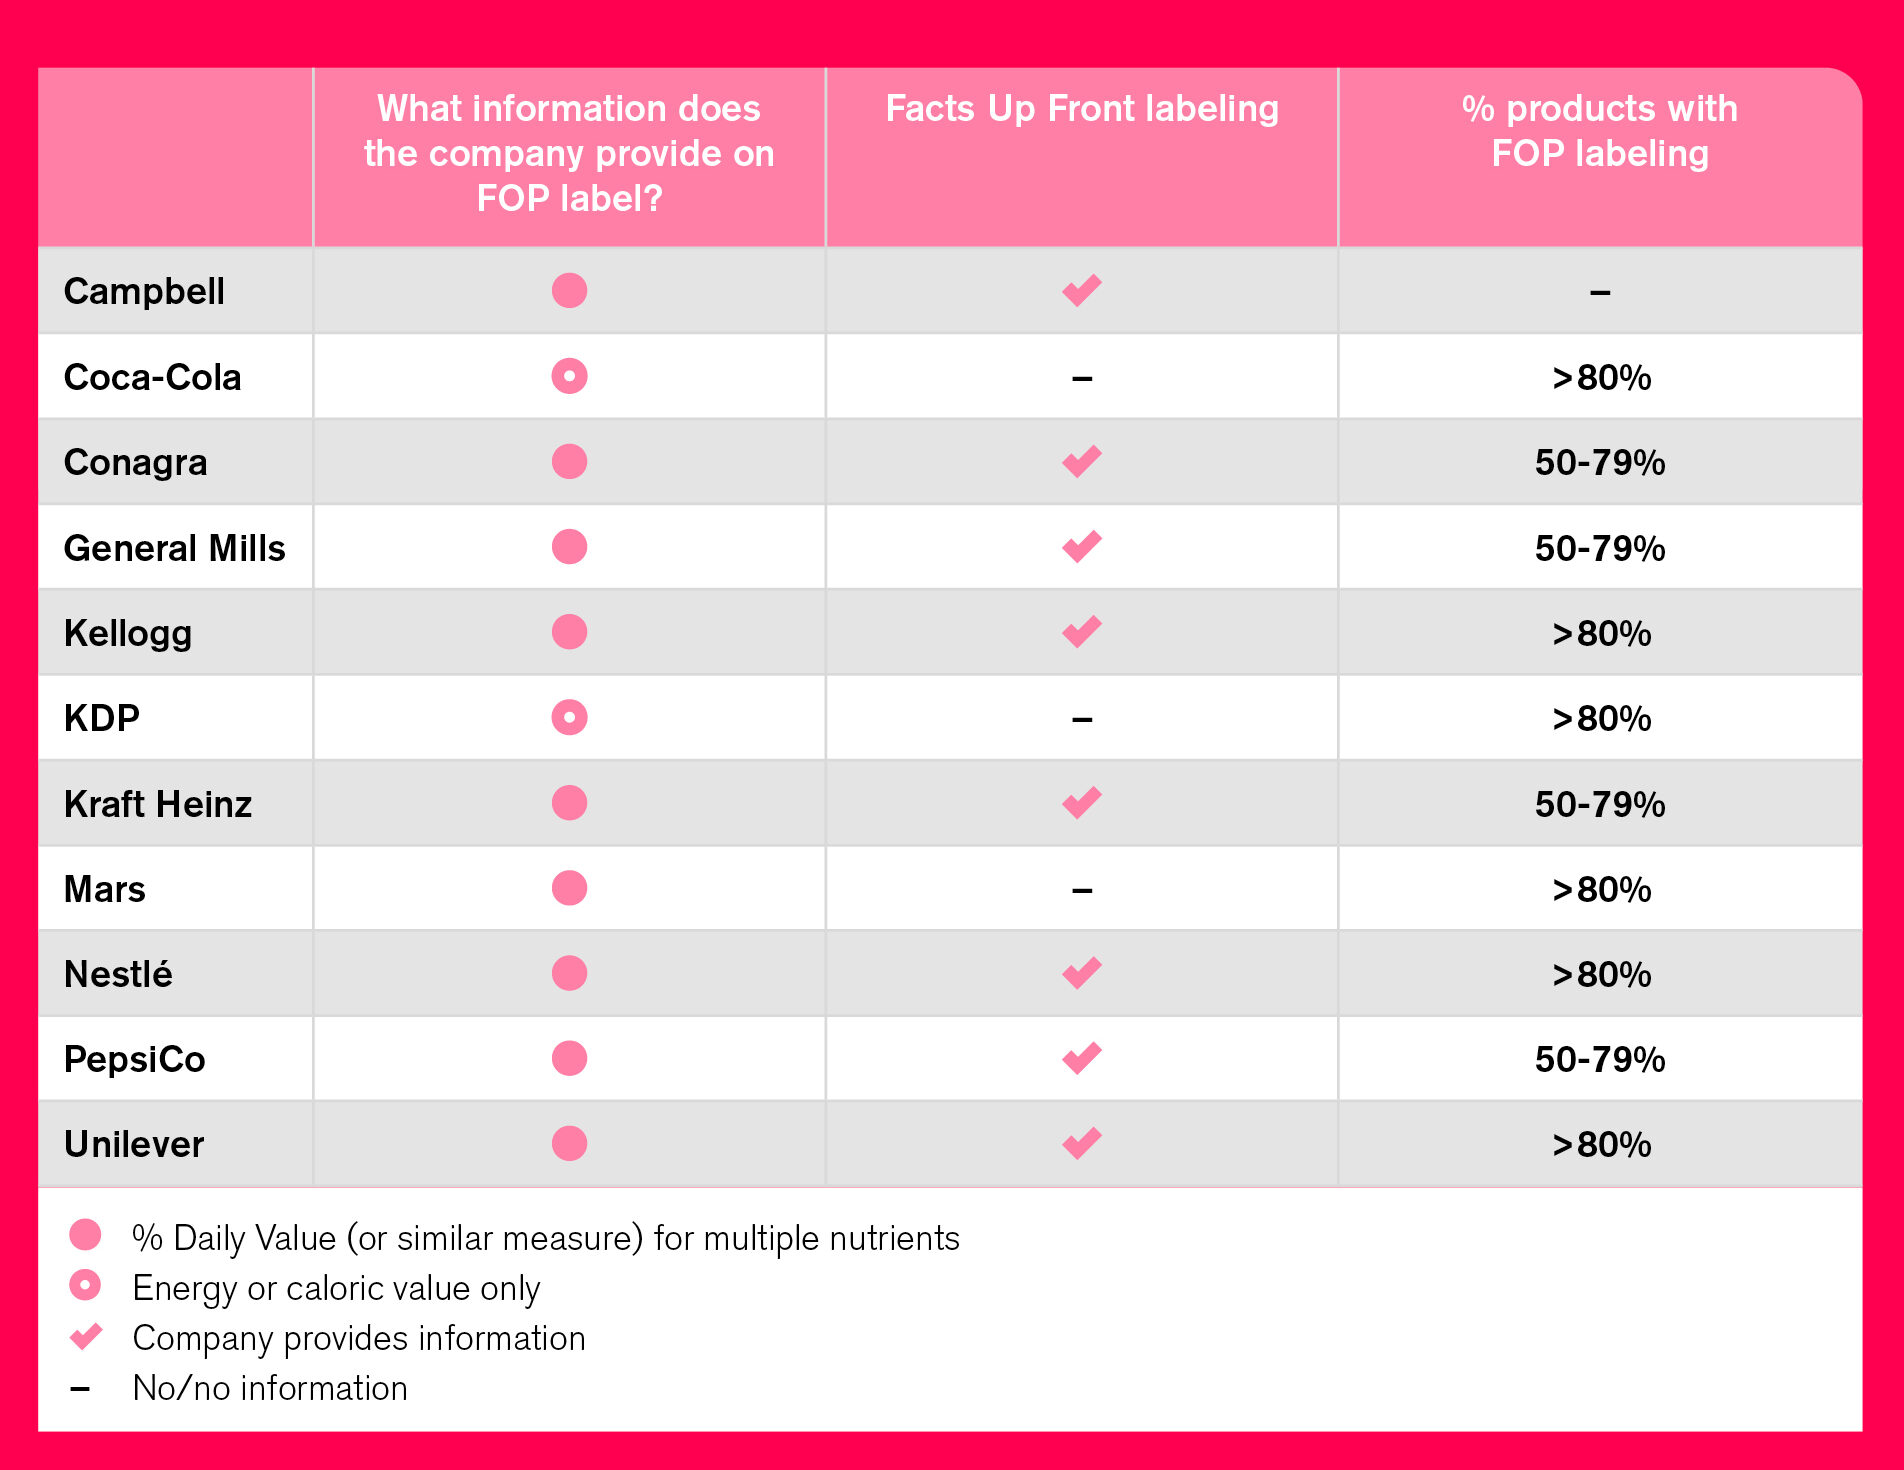
As of 2018, all 11 companies commit to putting some nutritional information on FOP – although the amount of information varies. Nine companies commit to displaying information as a percentage of Daily Values (DV) (or similar measure) of multiple nutrients, of which General Mills, Kellogg, Mars, Nestlé, Kraft Heinz, and Unilever use Facts Up Front. Two companies, Coca-Cola and KDP, display energy or caloric information on FOP.
It is encouraging that six companies now implement FOP labeling on more than 80% of products, with Kellogg and KDP now joining Mars, Nestlé, Coca-Cola, and Unilever in doing so. For Conagra, PepsiCo, and Kraft Heinz, the figure is between 50% and 79% – also an improvement since 2018 – while Campbell did not provide information.
However, none of the companies commit to using interpretive FOP labels, even though several of them commit to doing so in other markets. Kellogg states it is supportive of retailer programs such as the ‘Guiding Stars’ system, an interpretive labeling system used at point-of-sale, rather than on packages themselves.
Only four companies were found to provide some information about wholegrain content (relative to other grains) on product labels for relevant products. Campbell, Mars, and PepsiCo, for example, use the ‘whole grain stamp,’ which was developed by the Whole Grain Council and can be placed FOP on products to indicate the percentage of grains that are wholegrain (50%, 75%, or 100%) for products with at least 8g of wholegrains per serving. Kellogg, meanwhile, has detailed internal requirements for placing wholegrain claims on FOP, including the requirement that, for products in which less than half of total grains are wholegrains, it must disclose the exact percentage of wholegrains.
While providing some information regarding wholegrain content, these approaches fall short of sufficiently capturing the relative balance of wholegrains vs. refined grains and sugars. A better approach in this regard is recommended by the American Heart Association, which classifies grain products as ‘whole’ if the ratio of total carbohydrate-to-fiber, each in grams per serving, was less than, or equal to, 10:1.
Interesting example: Nestlé has been developing a ‘GRAINSMART balance’ system (in collaboration with Tufts University and other experts), whereby products with carbohydrates, fibers, and sugars that do not exceed a ratio of 10:1:2 can place a logo on-pack – thereby seeking to limit the amount of sugars and increase fiber content in such products.
It is important that companies use truthful representations, depictions, or images of a product’s ingredients on packaging: if fruits and vegetables are depicted, studies indicate consumers often interpret this to mean the product contains real fruits and vegetables, and that the product overall is healthier. It is important, therefore, that companies only do so when a product does contain meaningful amounts of fruits and/or vegetables, and that they display the amounts used. In addition, companies should display the amount (as part of full servings) of ‘nutrient-dense’ ingredients derived from fruits and vegetables, meaning in whole, cut, dried, pulp, puree, 100% juice, or fully reconstituted concentrate form – and not concentrates, powders, or other ingredients. Four companies – Campbell, General Mills, Nestlé, and Unilever – demonstrated that is possible to provide this information by applying it on at least some products (although not all).
With online grocery sales increasing, it is important for companies to display nutrition information online to ensure it is as accessible as through the in-store purchasing of products. Encouragingly, nine companies were found to provide online nutrition information for more than 80% of products, including Conagra, Kraft Heinz, and Mars, who did not show this practice in 2018. Six of these companies (Conagra, General Mills, Kellogg, PepsiCo, Kraft Heinz, and Unilever) provide this information through the SmartLabel system. Coca-Cola and Nestlé provide information online for between 50% and 79% of their portfolio.
To improve commitments and accelerate action on product labeling, ATNI encourages the food & beverage manufacturers assessed in this Index to consider the following recommendations:
-
Companies are encouraged to support the FDA’s efforts to develop an interpretive FOP system at the federal level that effectively communicates to consumers the healthiness of a product; they should not, however, push for a weak system, with minimum incentives for companies to use it. A mandatory system, for example, would level the playing-field for all companies’ products.
-
It is important that companies provide detailed nutrition information online for all products in the US to an equal or greater extent than on the physical product. Using the SmartLabel system, for example, is one approach to enhancing access to this information for consumers.
-
All relevant companies should consider enhancing the information disclosed on-pack regarding wholegrains.
- Companies are advised to commit to using truthful representations, depictions, or images of fruits and vegetables used as ingredients. They are also advised to clearly display the amount of ’nutrient-dense’ ingredients derived from positive food components, such as fruits and vegetables, fiber and wholegrains, contained on relevant product labels in the US, to provide consumers with a better understanding of the nutrient content and healthiness of these products.