Global Index 2018
The Global Access to Nutrition Index 2018 is the third Global Index published by the Access To Nutrition Initiative (ATNI). The first was published in 2013 and the second in 2016.

“The Global Access to Nutrition Index 2018 brings good and bad news. On the one hand, we see evidence that a number of companies are upping their commitments to tackle various aspects of the nutrition challenges but in general companies need to get better at ‘walking the talk”
Inge Kauer
Executive Director, Access
to Nutrition Initiative
The Global Access to Nutrition Index focusses on the role that food and beverage manufacturers play in making healthy food affordable and accessible to all consumers globally. In the Global Index 2018, the 22 largest food and beverage manufacturers in the world are ranked on their nutrition-related policies, practices and performance. The companies assessed operate in over 200 countries and generate approximately $500 billion in sales. They therefore have a huge influence on the diets of consumers and ATNI believes that these companies have an important role to play in addressing the world’s nutrition challenges.
This Global Index 2018, for the first time, includes a Product Profile which assesses the nutritional quality of the Index constituents’ products. This Index again features a sub-ranking of the compliance of the world’s six largest manufacturers of breast-milk substitutes (BMS) with the International Code of Marketing of Breast-milk Substitutes and subsequent World Health Assembly resolutions.
Ranking 2018
Since 2016, several companies have stepped up efforts to encourage better diets. The average Index score improved from 2.5 in 2016 to 3.3 in 2018. Overall, the 2018 results show that all companies need to do much more to walk their talk.
The 2018 ranking is led by Nestlé with a score of 6.8, up from 5.9 in 2016. It delivered above average performance in all, and improvements in most, of the categories of the Index. Unilever is second (6.7 versus 6.4 in 2016), and Danone third (6.3 versus 4.9 in 2016). The average score of all companies improved from 2.5 in 2016 to 3.3 in 2018. Nine companies now score 5 or more, compared to only 2 in 2016.
Friesland Campina leads the undernutrition sub-ranking and showed the greatest improvement. Danone, Grupo Bimbo, Kellogg and Mondelez also increased their score by two points or more, compared to 2016. More companies (11 in 2018, compared to 8 in 2016) commit to addressing undernutrition, responding positively to Sustainable Development Goal 2: End hunger, achieve food security and improved nutrition.
- A
- Governance
- B
- Products
- C
- Accessibility
- D
- Marketing
- E
- Lifestyles
- F
- Labeling
- G
- Engagement
- BMS
- Assessed against the BMS methodology: An adjustment based on the BMS score is incorporated in the overall score
- *
- Did not provide information to ATNI
Companies
Based on total global sales in 2016, the 22 largest global food and beverage manufacturers were selected for inclusion in the 2018 Global ATNI.
Findings
The 2018 Index shows the world’s biggest F&B companies have stepped up their efforts to encourage better diets, mostly through new and updated nutrition strategies and policies, improved commitments on affordability and accessibility, better performance on nutrition labeling and health and nutrition claims, and more disclosure of information across categories. Nevertheless, ATNF has serious concerns about the healthiness of the world’s largest global F&B manufacturers’ product portfolios.

Finding 1
Nestlé leads the ranking with a score of 6.8, up from 5.9 in 2016. Unilever is second (6.7 versus 6.4 in 2016), and Danone third (6.3 versus 4.9 in 2016).
Finding 2
FrieslandCampina shows the greatest improvement from 2016, from 2.8 to 6.0.
Finding 3
Friesland Campina leads the undernutrition sub-ranking and showed the greatest improvement. Danone, Grupo Bimbo, Kellogg and Mondelez also increased their score by two points or more, compared to 2016.
"It is alarming that less than a third of the products surveyed by the Access to Nutrition Initiative were classified as healthy. The difference between our analysis and companies’ own assessments shows the need for more transparency on how companies measure healthiness and set targets to improve it. Companies can and should do more to develop and market healthier products. We urge them to take action.” - Paulus Verschuren, Chair of the Access to Nutrition Initiative
Best practices
Example of best practice: The operating principles embodied in Nestlé’s ‘Creating Shared Value’ strategy include a comprehensive set of nutrition policies covering all areas that the ATNI methodology assesses. The company has defined 15 measurable 2020 nutrition-related commitments against which it reports progress. Nestlé links all of these commitments to the relevant SDGs.
Recommendations
The 2018 Index report calls on companies to, first and foremost, work to improve the nutritional quality of their existing products, particularly established, high-sales volume products. Read the full set of comprehensive recommendations.
Future Opportunities
ATNI sees many opportunities to develop its work and amplify its impact. For the next Global Index, we intend to streamline the methodology to reduce the time required from companies to provide input to the research process. We will also look to utilize more independently generated research and/or verify data submitted by companies, similar to the approach used for the Product Profile.
Corporate Profile
The Corporate Profile assesses companies’ nutrition and undernutrition-related commitments and policies, practices and disclosure in seven categories.
The Corporate Profile assesses companies’ nutrition and undernutrition-related commitments and policies, practices and disclosure in seven categories.
Governance
The average Category A nutrition score increased to 4.7 from 3.9 in 2016 (as shown in Figure 2), and Nestlé currently leads the score with 9.8 points. FrieslandCampina showed the largest improvement by increasing its score by almost 4 points, mainly due to its new more comprehensive nutrition strategy and strengthened nutrition governance and management system. Category A remains the highest-scoring category on the Index. Many companies have strengthened their nutrition policies and management systems.
FullReport
Products
The average score increased to 3.4 from 2.8 in 2016 (as shown in Figure 2), and Nestlé currently leads the ranking with a score of 8.0 points. Campbell’s showed the largest improvement by increasing its score by three points, mainly related to more reporting on nutritional criteria, which are therefore now recognized as a precursor to a NPS in Criterion B2.
FullReport
Accessibility
The average Category C nutrition score increased to 2.4 from 0.9 in 2016, and Grupo Bimbo currently leads with 7.0 points. PepsiCo showed the largest improvement by increasing its score by more than 5 points. Since 2016, on average, Category C performance has considerably improved. While scores are still very low (2.4 out of 10), they have more than doubled between 2016 and 2018.
FullReport
Marketing
The average Category D nutrition score increased to 3.9 from 3.8 in 2016, and Mars currently leads the ranking with a score of 9.5 points. FrieslandCampina showed the largest improvement by increasing its score by almost five points, primarily related to its updated global responsible marketing guidelines, which were updated in 2017. Since 2016, companies strengthened their responsible marketing commitments – seven companies updated their marketing commitments to all consumers, and ten companies updated their marketing commitments to children.
FullReport
Lifestyles
The average score increased to 3.4 from 2.5 in 2016, and Nestlé currently leads the ranking with a score of 8.0 points. PepsiCo showed the largest improvement by increasing its score by more than three points, which is mostly related to clearer articulation of expected health and business outcomes in relation to the nutrition, diet and activity elements of its health and wellness program. Since the previous Index, companies’ support for healthy diets and active lifestyles overall has increased.
FullReport
Labeling
The average score increased to 4.0 from 2.5 in 2016 (as shown in Figure 2), and Mondelez leads the ranking with 9.2 points. Mars showed the most improvement by increasing its score by more than five points, which is mostly related to the complete roll-out of its labeling commitments and disclosure of this information, as well as its tracking of health and nutrition claims, which was not reported in 2016. Overall, companies have made considerable progress on nutrition labeling since 2016.
FullReport
Engagement
The average score decreased to 3.9 from 4.0 in 2016. Nestlé and PepsiCo lead the ranking, both with a score of 7.9 points. PepsiCo also showed the largest improvement in score, increasing more than three points, mainly due to disclosing more information regarding structured stakeholder engagement (related to criteria G2). Performance related to stakeholder engagement (in Criterion G2) has improved, with the majority of companies providing relevant evidence of using stakeholder input to inform their nutrition policies and programs.
FullReport
Governance
The average score increased substantially from 2.5 to four points. However, there is clearly still room to do much more. Unilever leads the rankings in Category A with the most comprehensive approach to address undernutrition, followed by Nestlé, FrieslandCampina, Kellogg and Danone.
FullReport
Products
Progress has been made compared to 2016 as more companies make commitments to develop fortified or other appropriate products to address undernutrition. However, the quality of these commitments falls well below the expectations they raise through their commitments to address undernutrition. The average score increased from 2.5 to 3.1 points. Danone leads the ranking in Category B – Undernutrition as it makes a number of relevant commitments, demonstrates it is developing or already offers a range of products fighting undernutrition and discloses many of its commitments publicly. It is followed by Unilever, FrieslandCampina, PepsiCo, Mondelez and Nestlé.
FullReport
Accessibility
More companies make commitments and provide examples of improving the affordability and accessibility of products formulated to address undernutrition in underserved populations, increasing the score from 2.2 to 3.5 points. Unilever leads the ranking in Category C because it has the most complete set of commitments, provides good evidence of performance and public disclosure thereof. It is followed by FrieslandCampina, Grupo Bimbo and Nestlé.
FullReport
Marketing
More companies report a relevant commitment and provide more evidence than they did in 2016. Category D indicators related to undernutrition were not scored in 2016, therefore a comparison in score is not possible. Although the average score is low with 1.8 points, FrieslandCampina leads the ranking in Category D Undernutrition with an almost full score, followed by Kellogg, Nestlé and Mars.
FullReport
Lifestyles
Compared to 2016, more companies make a commitment to educate undernourished consumers in developing countries about healthy foods (that address micronutrient deficiencies) by supporting relevant programs, while the public disclosure of information regarding these programs has remained fairly stable. Overall, only eight companies report supporting relevant undernutrition education programs in developing countries, which is the lowest across the seven categories in the assessment related to undernutrition. The average score increased from 1.5 to 2.5 points. Mondelez leads the ranking with a clearly defined and publicly disclosed approach to fund and support independently designed and evaluated programs, followed by Nestlé, Kellogg, PepsiCo and Ajinomoto.
FullReport
Labeling
More companies make and disclose relevant commitments, increasing the average score from 1.6 to 3.8 points. Grupo Bimbo, Mars and Nestlé achieved a full score. They were followed in the ranking by Danone, FrieslandCampina, Mondelez and Unilever.
FullReport
Engagement
The average score in Category G, related to undernutrition, remained fairly stable increasing from 1.7 to 2.3 points Unilever leads the ranking for this category, followed by Ajinomoto, Kellogg, FrieslandCampina and Danone.
FullReport
- A1
- Strategy
- A2
- Management
- A3
- Strategy
- B1
- Formulation
- B2
- Profiling
- C1
- Pricing
- C2
- Distribution
- D1
- Policy (all)
- D2
- Compliance (all)
- D3
- Policy (children)
- D4
- Compliance (children)
- E1
- Employees
- E2
- Breastfeeding
- E3
- Consumers
- F1
- Facts
- F2
- Claims
- G1
- Lobbying
- G2
- Stakeholder
- *
- Did not provide information to ATNI
Product Profile
The purpose of this Product Profile is to begin to build a picture of the role that products of companies in the Global Index play in consumers’ diets. It is designed to assess how healthy companies’ products are. In other words, to establish the nutritional quality of the products they sell, which is determined by the levels of fat, salt, sugar, fruit, vegetables and other ingredients.

FrieslandCampina tops the Product Profile ranking with 7.7 out of 10, based on 2016 sales-weighted estimates.
In the Product Profile, dairy companies are ranked highest and companies with diverse portfolios (such as Nestlé, Unilever and PepsiCo) end up in the middle of the ranking.
The healthiness of product portfolios vary by country. HSR scores in developed countries such as the U.S. (2.6), New Zealand (2.6) and the U.K. (2.3) are higher than those of emerging markets such as India (2.1) and China (1.8).
While many companies reported their sales for 2016 generated by ‘healthy’ products, for the most part their definitions of ‘healthy’ appear less strict than that of the independent HSR system used in the Product Profile, which is of considerable concern. Read the full Product Profile report for detailed information on the healthiness of Index companies' product portfolios.
Breast-milk Substitutes
(BMS) Marketing
The world’s six largest baby food companies continue to market breast-milk substitutes using marketing practices that fall considerably below the standards of The International Code of Marketing of Breast-milk substitutes (The Code). Companies have a role to play in contributing to optimal infant and young child nutrition (ICYN). Breastfeeding is a crucial element of IYCN. Increasing breastfeeding to near universal levels could prevent over 820,000 deaths of children under five each year and provides lifetime protection against a range of illnesses. Inappropriate marketing of BMS can undermine optimal IYCN.
Danone leads the 2018 BMS Marketing sub-ranking with an overall score of 46%, a significant improvement on its score of 31% in 2016, when it ranked second. Nestlé's level of compliance is 45% overall, a 9% improvement on its score in 2016, though it has slipped to second place in this ranking. Abbott has jumped to the third place with an overall BMS Marketing score of 34%, compared to a score of only 7% in the last Index. Kraft Heinz scored zero and ranks last. Though several improvements were put in place, even the highest score of 46% is still far from complete compliance with recommendations of The Code.
Trends over Time
Visualize progress at a glance with ATNI trend-tracking tool.
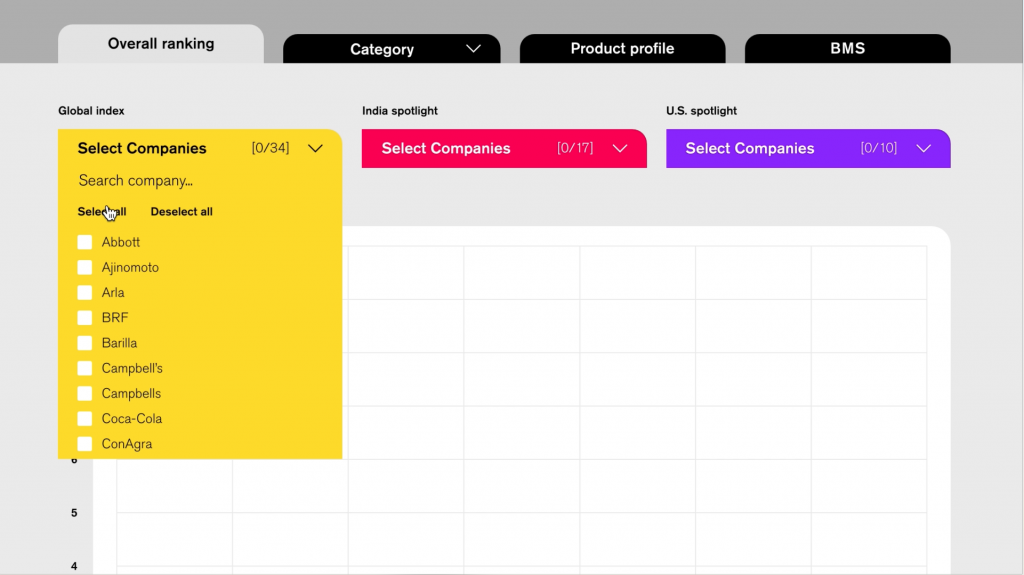
Embracing the latest progress in data visualization is an important objective for ATNI. With our trend-tracking tool, we intend to provide our stakeholders with a simple interactive interface which allows anyone to select companies, indicators and specific time ranges to compare companies ‘performance across time and within specific categories. To guarantee the overall consistency of our data across different channels of communication, we retrieve data from a single data source, namely our different indexes. Allowing our stakeholders to generate and download their own comparisons also helps us to ensure that ATNI’s findings are actively used and embedded in ongoing nutrition related initiatives.
Amplifying Impact
Companies urgently need to deliver on the Sustainable Development goals

End hunger, achieve
food security and
improved nutrition

Ensure healthy
lives and promote
well-being for all
ATNI encourages all stakeholders to actively use the 2018 Index results and provide their feedback to ATNI. We hope that the rated companies will commit to make changes based on our recommendations and that their investors will use them in their engagement with those companies to press for improvements in their policies, practices and disclosure. Further, we hope that governments and policymakers, NGOs, academics and others are able to use our analysis and findings in their work to encourage better diets worldwide.
The Global Index 2018 was produced by the Access to Nutrition Foundation (ATNF) team, consisting of Inge Kauer, Marije Boomsma, Paul Vos, Simona Kramer, Ellen Poolman, Fiona Kirk, Magdalis Mercillia and Rachel Crossley. The ATNF team drew on the expertise and advice of the ATNI Expert Group. Their close engagement throughout the ATNI development process has been a source of invaluable guidance, and this report benefited greatly from their input. The views expressed in this report, however, do not necessarily reflect the views of the group’s members or of their institutions.

Create Pdf
Access an overview of the major findings and recommendations of Global Index 2018 and obtain quick insights into current best practices of Food and Beverage companies with regards to nutrition.
Access the Global Index 2018 report in its entirety.
Select only the most relevant content to you via our dynamic interface and generate your customized report.
Select only the most relevant content to you via our dynamic interface and generate your customized report.
