The Retail Assessment 2025 analyzes 18 major retailers across six countries to assess how their policies and practices affect access to nutritious, affordable food through product healthiness, marketing, and pricing.

Modern food retailers influence consumer diets through product choices, pricing, promotions, and store design. As they expand—especially in low- and middle-income countries—their impact on nutrition and public health is growing. The rise of supermarkets and convenience stores is driving increased consumption of highly processed foods and rapidly rising rates of obesity- already affecting almost half the adult population in some countries- and diet-related non-communicable diseases.

ATNi’s Retail Assessment 2025 examines how 18 leading retailers across six countries affect access to nutritious, affordable food. Analyzing over 18,000 private-label products, the report looks at companies’ nutrition policies, promoted products, pricing and relative costs of healthy diets as well as current government policies to improve food retail environments. 

Using a four-part methodology, the report offers actionable insights for retailers, investors, and policymakers to support healthier, more affordable diets—especially in markets with a rapid increase in modern food retail.

This interactive dashboard shows the healthiness of private-label products for the top three retailers in each country, with results per category and individual retailer. Use the controls in the bottom right corner to zoom in.

Cost of Healthier and Less Healthy Baskets

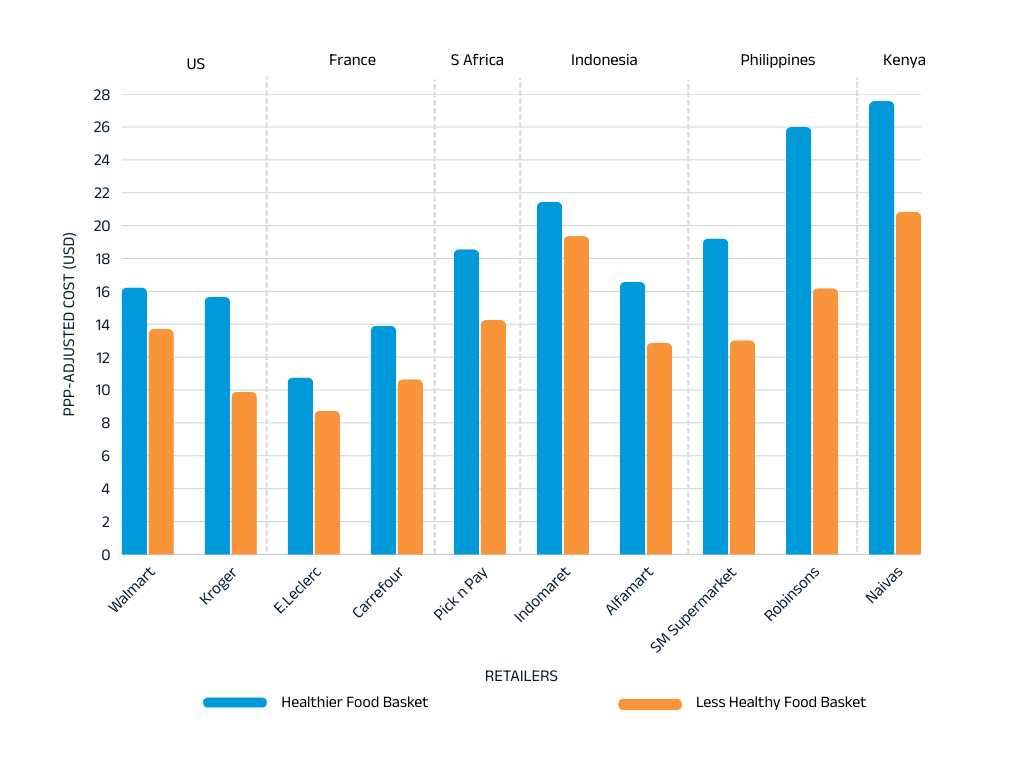
Healthier Diets Are More Expensive

  • Healthier food baskets cost 10% to 60% more than less healthy ones, across all countries and retailers.
  • In 2024, daily costs per person:
    – Healthier baskets: USD 10.76–27.58
    – Less healthy baskets: USD 8.74–20.84

Affordability Varies by Income Context

  • In high-income countries, both healthier and less healthy baskets cost <10% of daily per capita income.
  • In low- and middle-income countries (LMICs), healthier baskets cost 40–110% of daily per capita GNI.
  • Even in wealthy nations, low-income and minority groups face barriers to accessing nutritious food, despite proximity to modern retailers.

Retail Structures Are Reshaping Food Environments

  • In LMICs, modern retail is expanding rapidly, leading to a shift away from traditional diets towards more process and packaged foods.
  • Retailer strategies (pricing, placement, promotion) and urban lifestyles (time scarcity, dual-income households) drive this demand.

Private-Label Products Are Predominantly Unhealthy

Private label are already accounting for 20–40% of grocery spending in mature markets and expanding rapidly in emerging ones.

  • Only 41% out of retailers’ private-label portfolios met the ‘healthier’ threshold (Health Star Rating ≥ 3.5).
  • 86% of private-label products assessed were classified as unhealthy ultra-processed foods high in fat, sugar, salt, and/or containing additives like colors, flavors, and sweeteners.

Policies remain fragmented and largely voluntary

  • HICs assessed largely leaned toward voluntary measures and industry self-regulation.
  • LMICs assessed are showing greater momentum, driven by the rising rates of diet-related NCDs (e.g. regulations around front-of-package labelling, tax on sugar-sweetened beverages, restrictions on marketing of unhealthy food).


Executive Summary

Modern retailers have the power to shape consumer diets, yet current practices still favor unhealthy products. Healthier food remains costly, most items sold are unhealthy, and promotions often highlight less nutritious options. Regulatory efforts are fragmented and mostly voluntary.

Collaborative action is needed across sectors to improve access to healthier foods:

  • Retailers should embed nutrition into business strategies—reformulate products, balance promotions, and report on product healthiness using uniform standards.
  • Governments can create stronger policies—for example around mandatory front-of-pack labeling, regulations around product placement in stores, and restrictions around marketing unhealthy foods to children.
  • Investors should demand transparency and treat nutrition as a material issue, requiring retailers to disclose nutrition related KPIs.
  • Consumer groups can promote transparency and empower informed choices through tools like Open Food Facts.

Click a foldout to view the specific findings for each country.

US Country Findings
  • ATNi assessed three of the largest grocery retailers in the US: Walmart (~25–27% market share), Kroger (~6-8%), Ahold Delhaize USA / Food Lion (~2–4%).
  • All three assessed retailers have identified nutrition as a material risk and have taken steps to embed nutrition within their strategies. However, the extent of these commitments varies considerably.
  • Private labels account for ~20% of US grocery spend overall, and even higher for the three selected retailers: Walmart (20–25% sales); Kroger (~35%); Ahold Delhaize (targeting ~45% of sales by 2028 ).
  • All three retailers use their own profiling models/labeling systems, however these are not-government endorsed. None of the retailers publicly disclose robust commitments to responsibly market to children.
  • Of 7,687 products, the average HSR is 2.7, significantly below the Health Star Rating ‘healthier’ threshold of ≥ 3.5.
  • For each retailer, the percentage of their private-label products that can be considered ‘healthier’ according to HSR was: 45% (Food Lion), 40% (Kroger), and 39% (Walmart).
  • The majority of retailers’ private-label products are highly processed and/or high in fat, salt, and sugar, with 88% (Walmart and Kroger) and 84% (Food Lion) being high in fat salt and sugar and/or containing colors/flavors/non-nutritive sweeteners.
  • Retailers primarily promote unhealthy products, with healthy items only representing <20% of promotions in weekly flyers.
  • Healthier food baskets cost more than less healthy baskets. While US baskets are among the most affordable across the six-countries sampled, affordability gaps remain significant for low-income households.

Country Report
Policy Brief

Indonesia Country Findings
  • Alfamart and Indomaret dominate modern grocery retail (>70% combined), representing over 90% of convenience store sales. The next five retail chains account for 7.2% of grocery sales, predominantly through supermarket and hypermarket chains, such as Super Indo.
  • No publicly disclosed nutrition strategies were found for the two largest retailers; Alfamart or Indomaret. Furthermore, none of the three retailers assessed show evidence of public targets or policies to increase sales of healthier products, address shelf-space allocation, or commitments on responsible marketing to children. Super Indo, however, explicitly addresses nutrition in its sustainability strategy and has a store labelling system for signposting healthy and less healthy beverages.
  • Of 178 private-label products across the three retailers, only 21% met the healthiness threshold of HSR >3.5, with an average HSR of 2.0. This is substantially lower than the average of 41% of products meeting the healthiness threshold of HSR ≥3.5 across the six-countries included in the Retail Assessment.
  • The majority (93-98%) of private-label products were found to be high in fat, salt and sugar, and/or displaying markers of ultra-processing. This level is higher than the six-country average of 86%.
  • Within weekly promotional flyers, retailers’ promotions were primarily for unhealthy products. Only 32% of products promoted by Super Indo were considered ‘healthy’, followed by only 5% for Indomaret and 3% for Alfamart.
  • Analysis of pricing data for the retailer Indomaret indicated that a healthier food basket is 10.8% more expensive than a less healthy one. Furthermore, healthier baskets from Indomaret remain unaffordable for many, representing around 100% of daily per capita net income.

Country Report
Policy Brief

The Philippines Country Findings
  • SM Markets, Puregold, and Robinsons Retail collectively represent ~40% of modern grocery sales.
  • Limited evidence was found of nutrition strategies by the assessed retailers. While some evidence of labelling activities was identified, none of the three retailers have published commitments on responsible marketing to children.
    Healthiness of private-label products sold by the selected retailers was low, with only 28% of products meeting the Health Star Rating healthiness threshold of ≥ 3.5, with an average score of 2.3 stars.
  • The proportion of private-label products that were high in fat, salt and sugar, and/or displaying markers of ultra-processing was very high across all retailers, with 94% for SM Supermarket, and 91% for Robinsons.
  • Healthy items receive limited flyer share: Robinsons 20%, SM 12%; unhealthy products dominate promotions (SM unhealthy share 62%).
  • Pricing & affordability: Healthier baskets cost more at both retailers. At SM, healthier ≈ 50% of daily per-capita GNI vs 35% for less healthy; at Robinsons, healthier ≈ >70% vs 44% for less healthy. Even in PPP terms, modern-retail diets are only marginally affordable.

Country Report
Policy brief

The Retail Assessment 2025 analyzes the top three grocery retailers in six countries using four research components:

  1. Retail environment mapping – Examines market structure and trends.
  2. Retail strategy and performance – Assesses nutrition policies, promotional practices, and private-label product quality.
  3. Pricing and affordability – Compares costs of healthier vs. less healthy food baskets across income levels.
  4. Policy and regulatory gaps – Reviews national regulations and identifies gaps to support healthier retail environments.

Research was conducted between November 2024 and November 2025, drawing on secondary data (included Euromonitor International and Innova Market Insights), company disclosures, and national policy sources.


These were complemented by targeted primary online data collection across all countries and in-store data collection in Kenya.

Covering over 18,000 products, the assessment combines corporate disclosures, secondary data, and primary online and in-store research. It’s the first cross-country analysis of retail food environments across diverse income settings, offering insights for retailers, investors, and policymakers. Developed with expert input and global frameworks, it builds on ATNi’s 13 years of benchmarking experience, expanding its scope from food manufacturers (Global Index) to the retail sector.

Methodology

The Retail Assessment 2025 was developed by ATNi’s project team: Sameea Sheikh (Project lead), Dr. Brenda de Kok (Research lead), Will Sharp, Freddie von Kaufmann, Elwina Meylentia, Rachel Nel, Daniela Hernández Morales (Researchers), Mark Wijne, Babs Ates (Research oversight);  Eaindra Aye, Valda Rahima (Data analysts) and Aurélie Reynier (Data oversight); and Gulden Timur, Veronica Maxey (Communications officers), and Katherine Pittore (Communications and Policy lead); with overall support from Greg Garrett (Executive director). We also thank our colleagues Elena Schmider, Efi Chatzinikolaou (Investor engagement), Philip Eisenhart (Media and PR), and ATNi consultants Dr. Elizabeth Dunford (Product Profile), Kaitlyn Elavaza (Data collection), and Dr. Yinjie Zhu (Cost and Affordability).

The ATNi team drew on the expertise and advice of the ATNi Retail Assessment Advisory Group members: Prof. Adrian Cameron, Prof. Christina Vogel, Prof. Mary Story, Prof. Jessica Fanzo, Chris Holmes, and Prof. Poh Bee Koon. ATNi also thanks Dennis Petri for design support, WRENmedia for editing and proofreading, September Studio for web support, and 73Bit for setting up the data platform.

The information in this report is provided “as is”, without any express or implied warranties or representations. The findings in this report do not necessarily reflect the views of the group’s members or their institutions.

For the full disclaimer, please refer to the country reports.

email dropdown linkedin facebook twitter icon_input-select BMS Close Download Hamburger Performance Pijl Plus Product-Profile Share google-doc-tracking-XL Performance comparison-tool egagement-tracker-tool