Category B: Formulating appropriate products
Category B consists of three criteria:
- B1 Product Profile results (20% of overall score)
- B2 Product formulation (7.5% of overall score)
- B3 Defining healthy and appropriate products (7.5% of overall score)
To perform well in this category a company should:
- Have a healthy product portfolio overall, measured in the Product Profile using the Health Star Rating (HSR) nutrient profiling model.
- Have healthier products than other companies within the same product category.
- Demonstrate improvements in product portfolio over time.
- Commit to improving the nutritional quality of foods and beverages with the goal of having healthier portfolios (e.g., through research and development — R&D — investment).
- Set and disclose reformulation targets and performance against those targets in a consistent way that is easy for stakeholders to understand.
- Provide healthy and appropriate foods that help to address undernutrition and micronutrient deficiencies (e.g., through evidence-based fortification of foods).
- Adopt and disclose a robust scientific and evidence-based nutrient profiling model (NPM) and apply it to all relevant products, or commit to using a government-endorsed NPM.
- Commit to fortifying foods of underlying nutritional quality and/or meeting established nutrition criteria.
Ranking on Formulating appropriate products
Noteworthy changes and best practices
-
- B
Kraft Heinz shows the highest improvement in this category compared to the Global Index 2018. The company’s score has improved from 0.6 to 3.3 in 2021. Kraft Heinz has adopted new ‘Global Nutritional Guidelines’ which list thresholds for nutrients per product category, which is considered by ATNI a precursor to a full NPM. The company reports exceeding its target of 70 percent compliance with the guidelines four years early, and has committed to achieving 85 percent portfolio compliance by 2025. The company discloses the number of products that meet its guidelines, at 76 percent in 2019 according to the company’s 2020 Environmental Social Governance (ESG) Report.
-
- B
Danone disclosed its benchmark on alignment of its definition of healthy categories with HSR. Danone’s ‘healthy categories’ are benchmarked against the HSR and the information is publicly disclosed. The percentage of healthy products in Danone’s portfolio is 90 percent according to the company’s own criteria, and accounts for 88.3% of sales (water represents about two-thirds of Danone’s total sales in volume) when utilizing the HSR healthy threshold (HSR >=3.5). In the Product Profile, a total of 1,626 products across 10 markets were assessed for Danone, and 997 (61 percent) met the ‘healthy’ threshold. The company uses volume data excluding plant- based products, whilst the Product Profile utilized retail sales including the plant-based segment- one of the reasons the company’s figures differ from those of the Product Profile.
-

- B
Kellogg reports using an independent NPM, Nutri-Score, as a tool to reformulate products. The company has developed its own ‘K Score system,’ which calculates overall nutritional quality scores for each product. The K Score is based on a combination of the Nutri-Score model, clean label score (i.e., no use of artificial colors and preservatives), and a ‘micronutrient score’ (based on the quantity of vitamins and minerals present at a claimable level.)
-
- B
In 2020, Grupo Bimbo published its own NPM to inform nutritional guidelines. Grupo Bimbo’s NPM is validated using a government-endorsed system (UK Food Standards Agency model). Their nutrition strategy includes, among others, a new commitment for products in the ‘daily’ segment to reach 100% compliance with its nutritional profile by 2023 (extended from 2020). The company’s nutritional guidelines include definitions of product categories and category specific nutrient thresholds, which helps in holding the company to account for its commitments.
-
- B
Unilever sets new goals to deliver positive nutrition. Unilever released a Foods & Refreshment strategy as part of its newly- defined ‘Boldly Healthy’ commitments in 2020 and the longer-term ‘Future Foods’ strategy. In addition to its reformulation goal of 70 percent of foods to meet company’s nutrition criteria by 2022, the company has committed to double the number of products sold that deliver positive nutrition by 2025. Unilever defines ‘nutrition positive’ those foods which contain significant, impactful amounts of crucial ingredients and macronutrients, like vegetables or proteins, and/or micronutrients, like vitamins and minerals. The company informed ATNI it is in the process of revising its NPM or ‘Unilever Highest Nutritional Standards’ (HNS) to include positive nutrients as well as a sugar benchmarks for all product groups.
Apart from this, the company’s Knorr brand has defined the ambition to achieve 25% of Knorr’s portfolio containing Future 50 Foods and 50% of the portfolio to be plant-based by 2025. Unilever has partnered with World Wildlife Fund (WWF) and other experts to identify 50 plant-based ingredients (Future 50 Foods), based on their nutritional value and relative impact on the environment.
B1: Product Profile results
Danone ranks first in the Product Profile with a score of 8.2 out of 10, followed by FrieslandCampina (7.4) and Nestlé (7.2). Danone achieves the highest mean healthiness score (6.9 or HSR of 3.5) — an indication of the nutritional quality of the company’s products in best-selling categories across major markets. Mars and Danone achieve the highest score in the second scored element, which measures the relative healthiness of product categories compared to peers. For Ferrero, Mondelez and Nestlé, their improvements in mean HSR in selected markets- i.e. the third scored element, contribute significantly to their final Product Profile scores (illustrated in light blue, below).
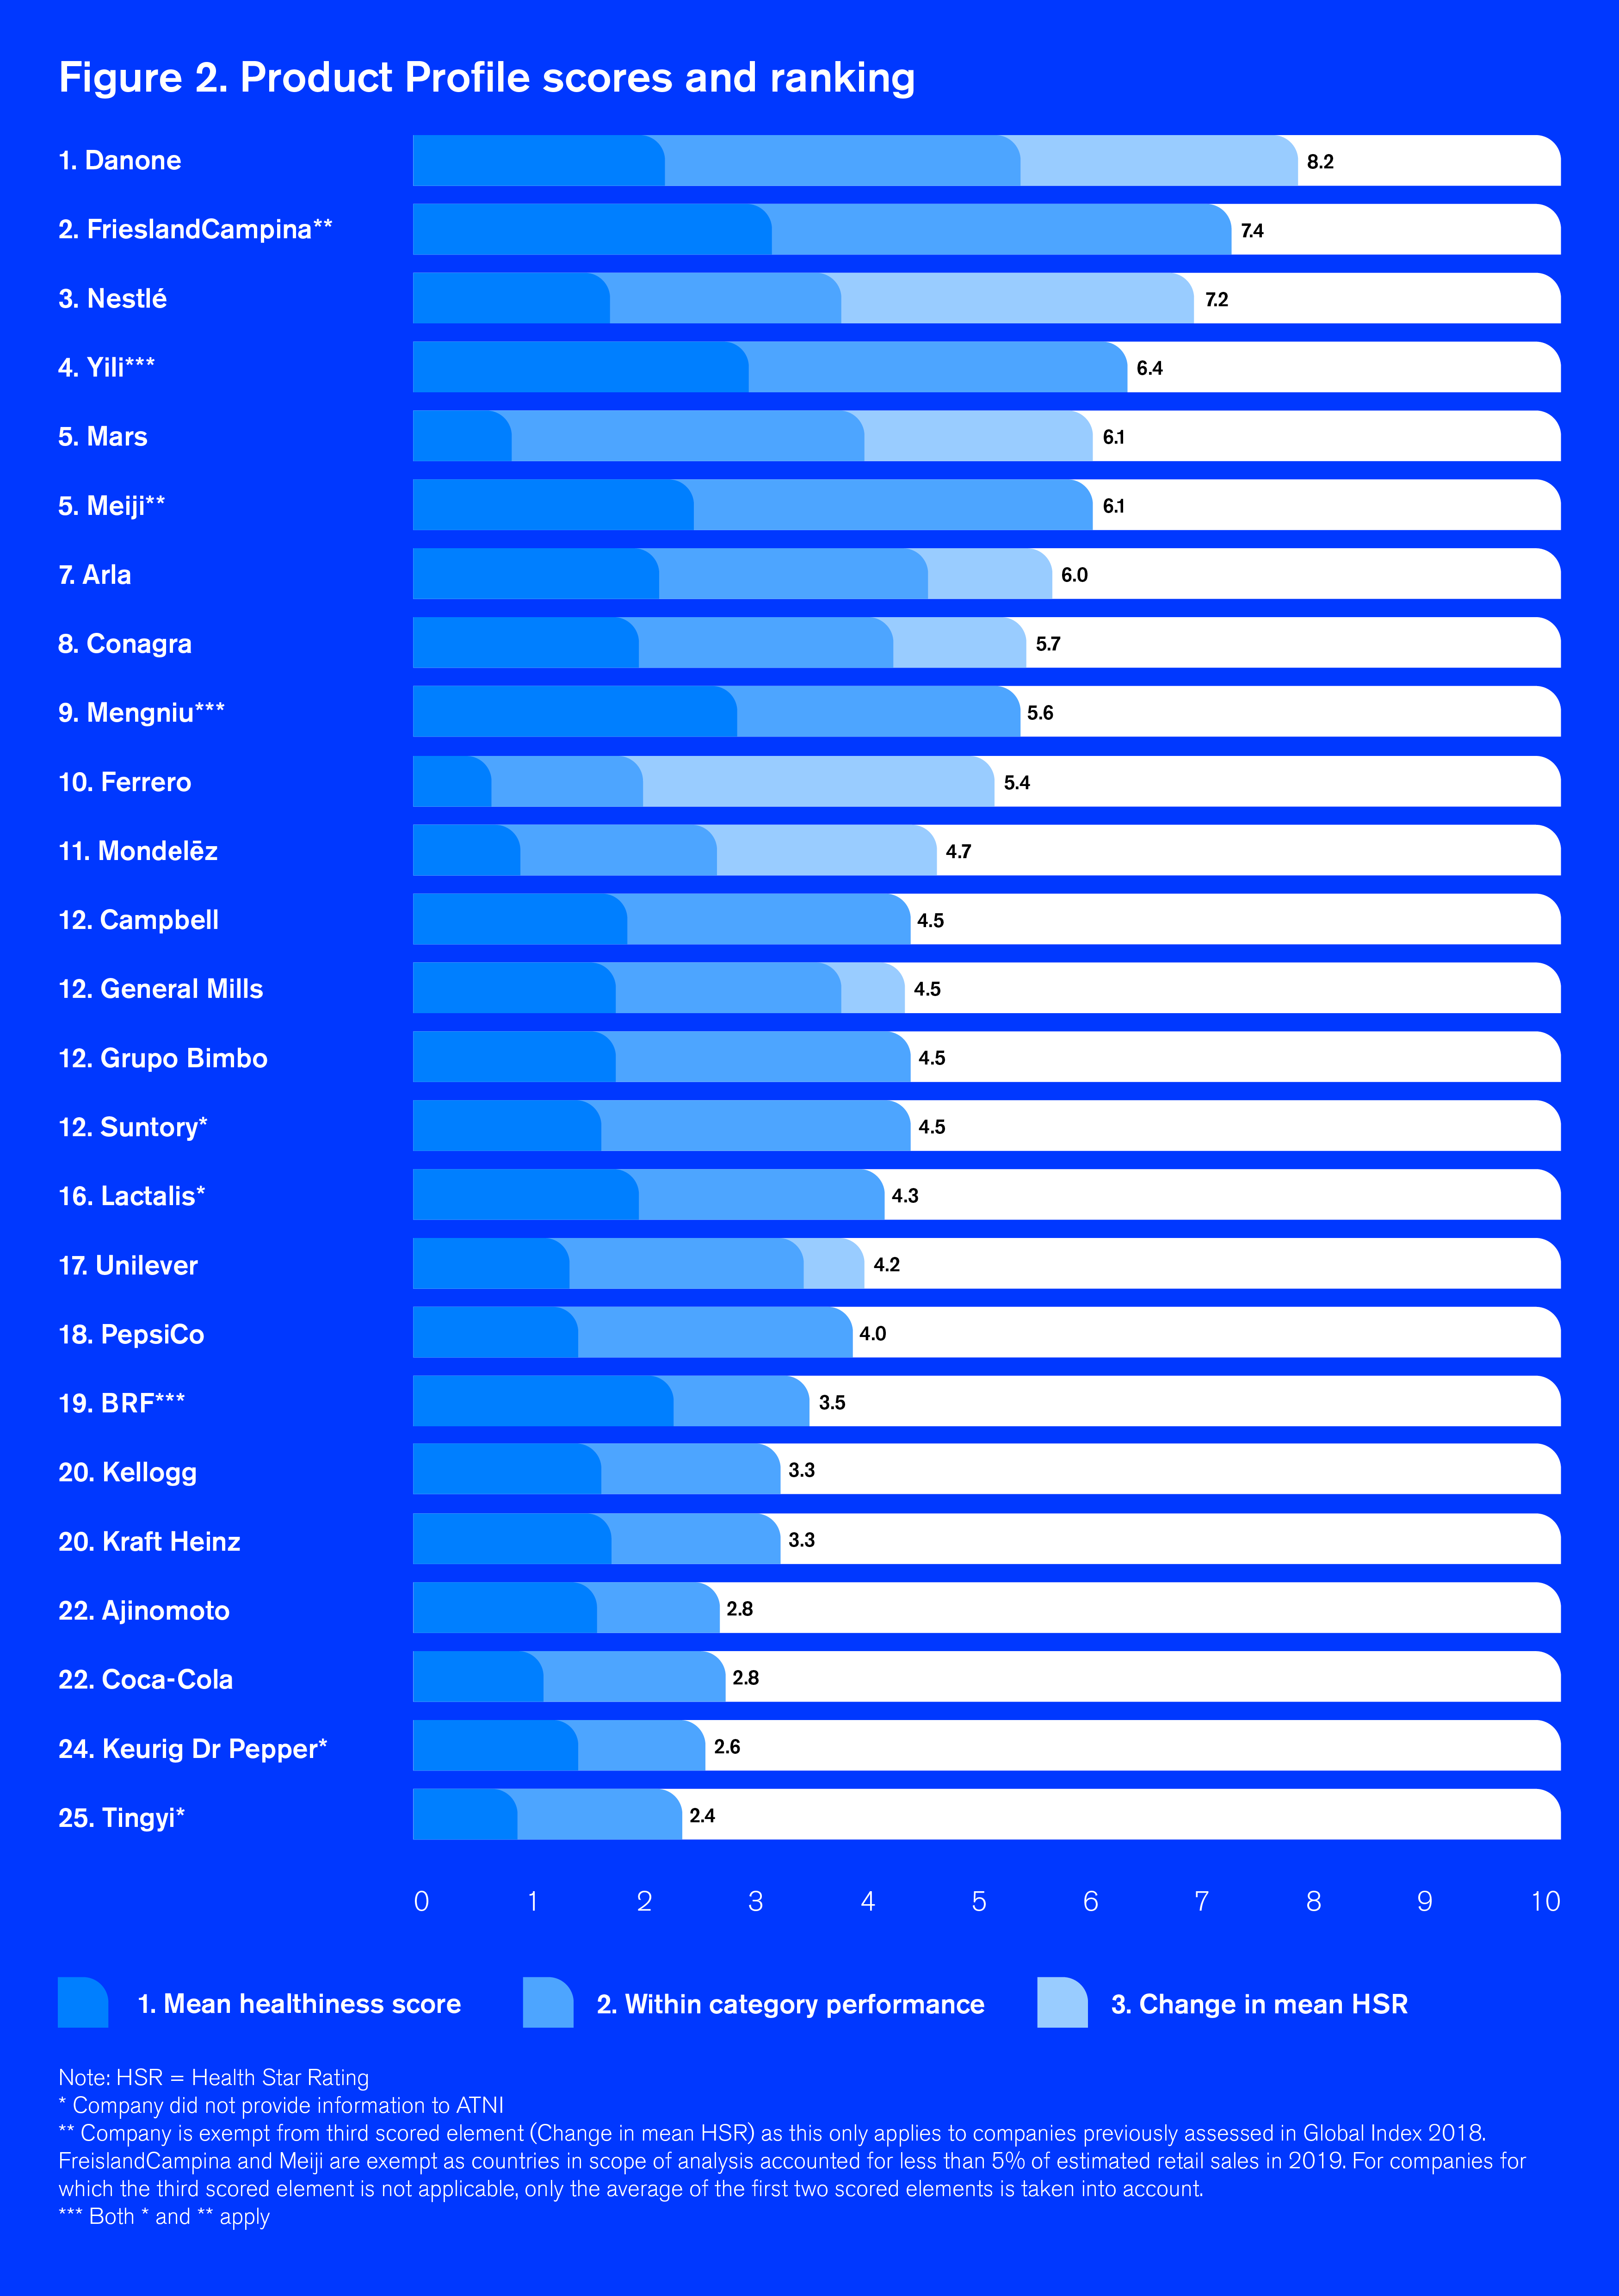
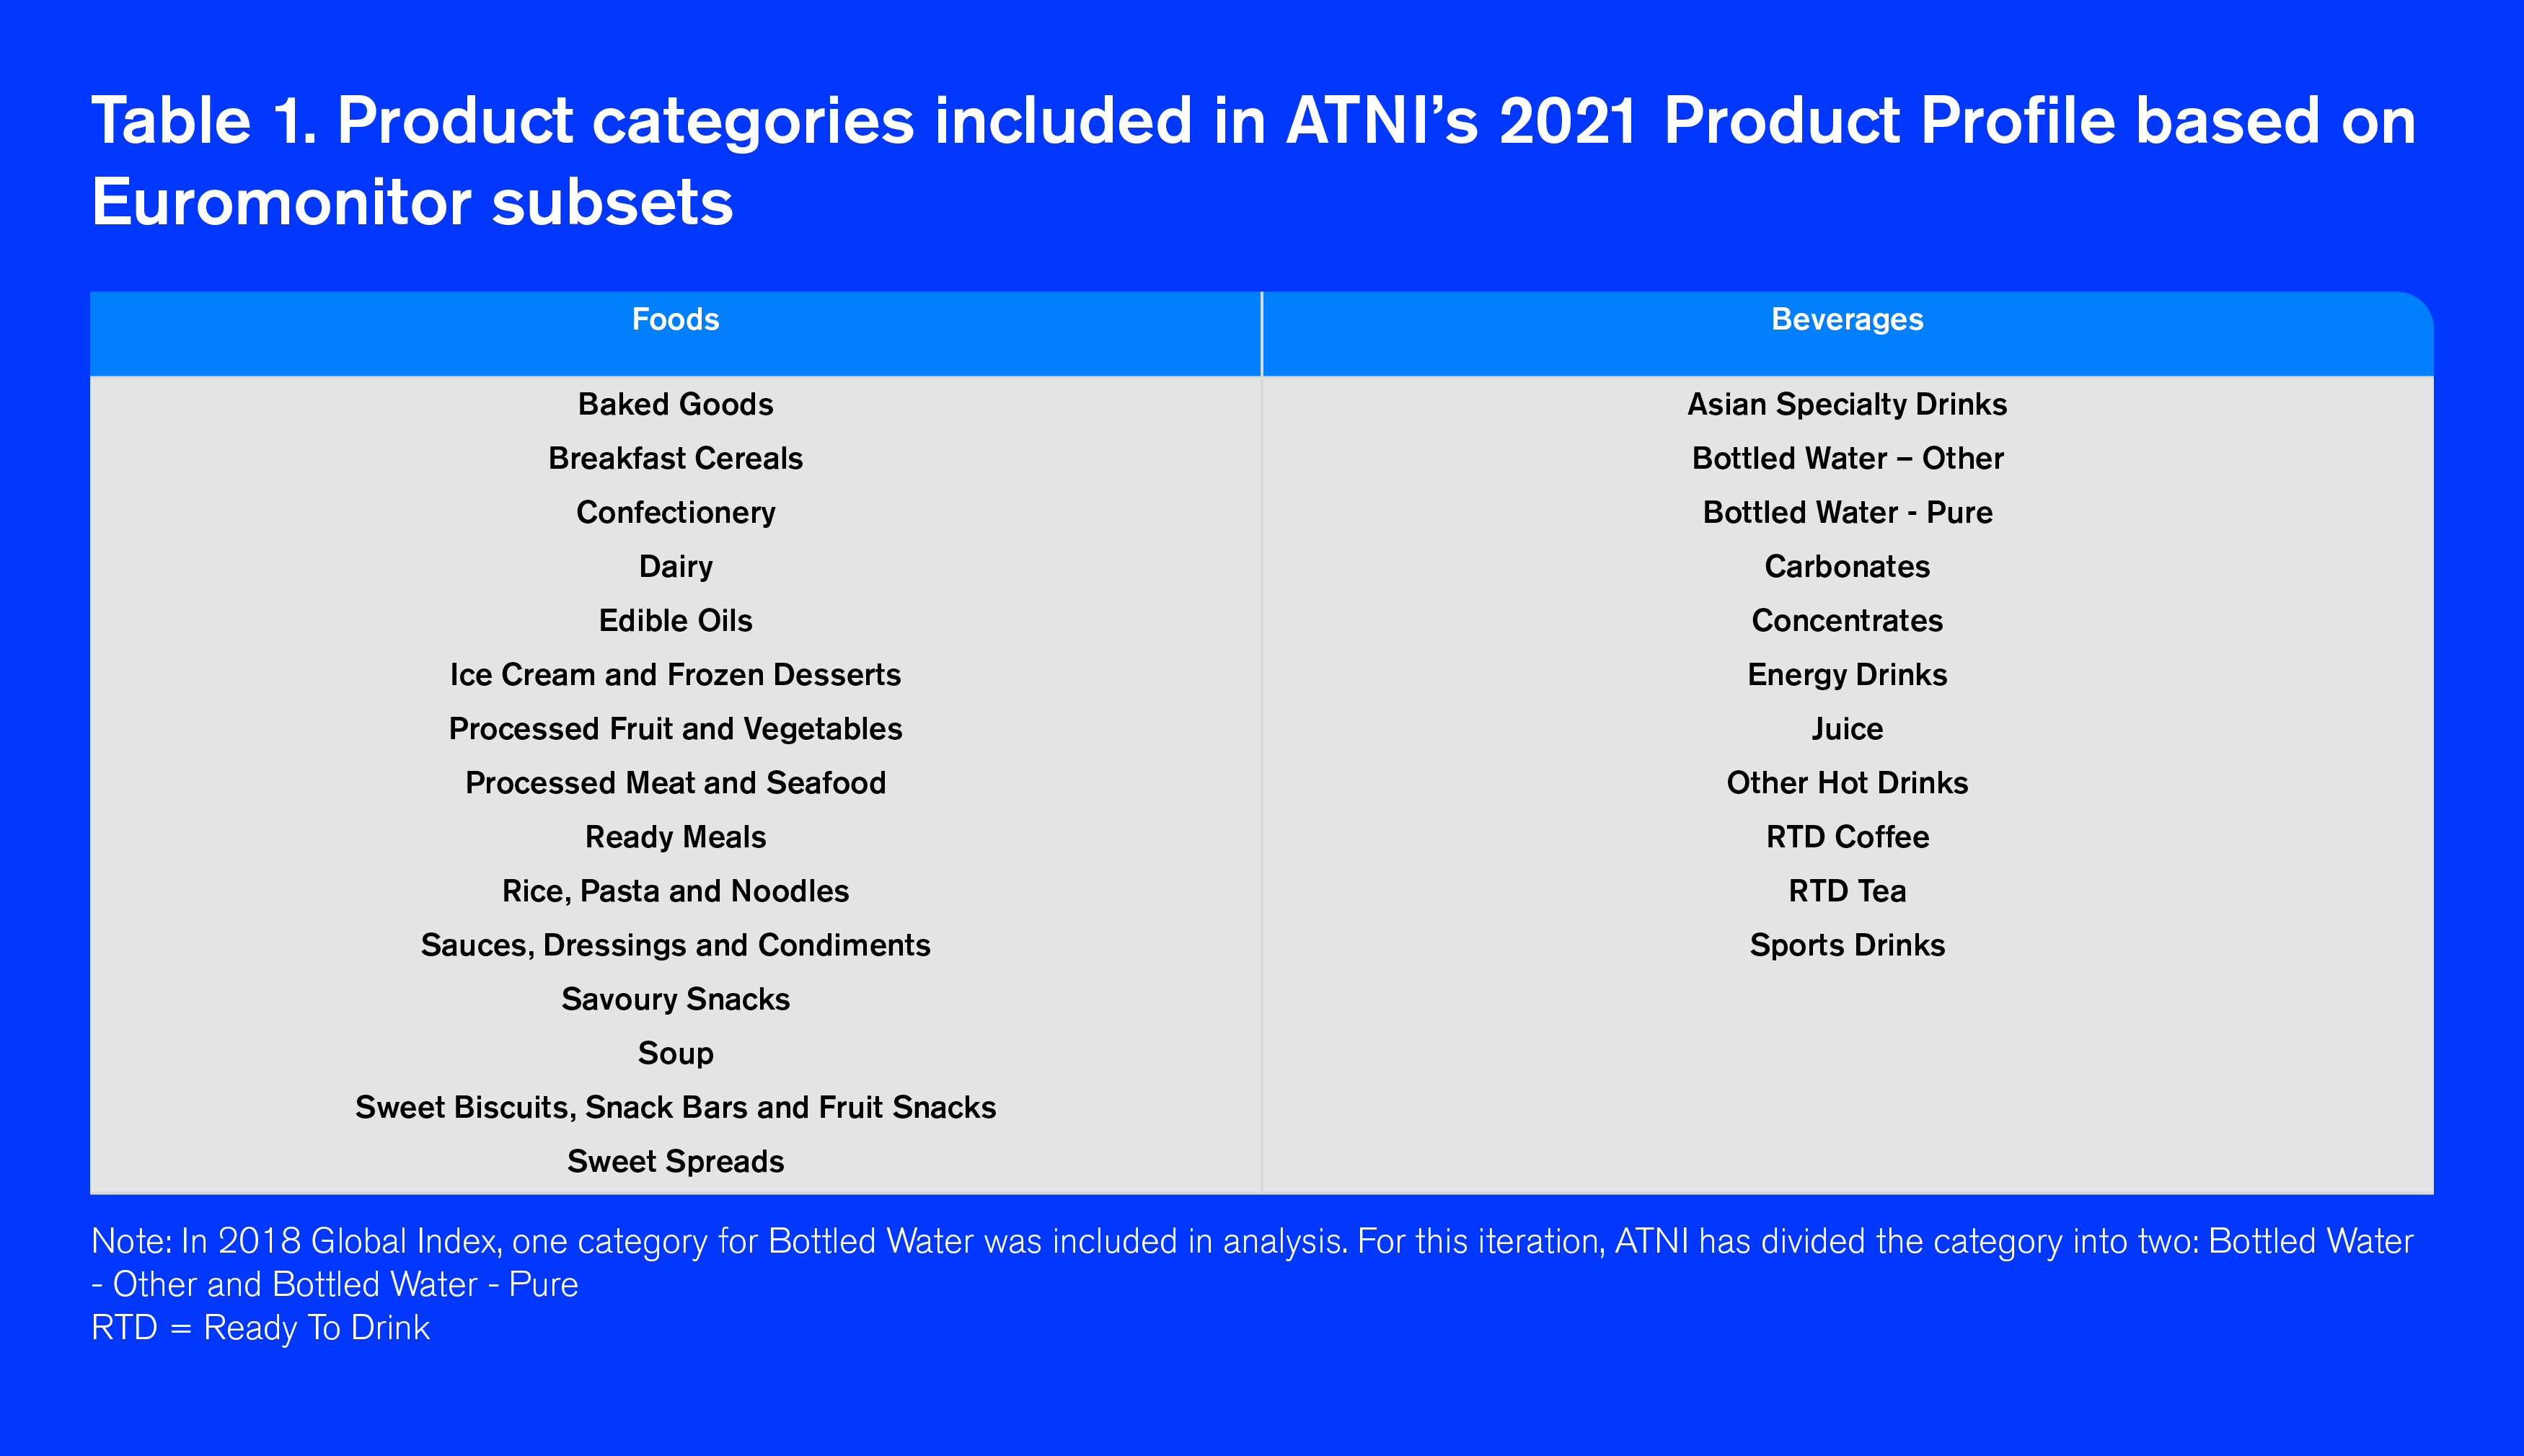
Up to 10 major markets are selected for analysis for each company, aiming to cover 80% or more of their global retail sales. The top five best-selling product categories within each market were identified according to the Euromonitor International database, to avoid assessing large numbers of niche products with low sales. Please see Table 1 in Annex. For more information, see the Global Index methodology.
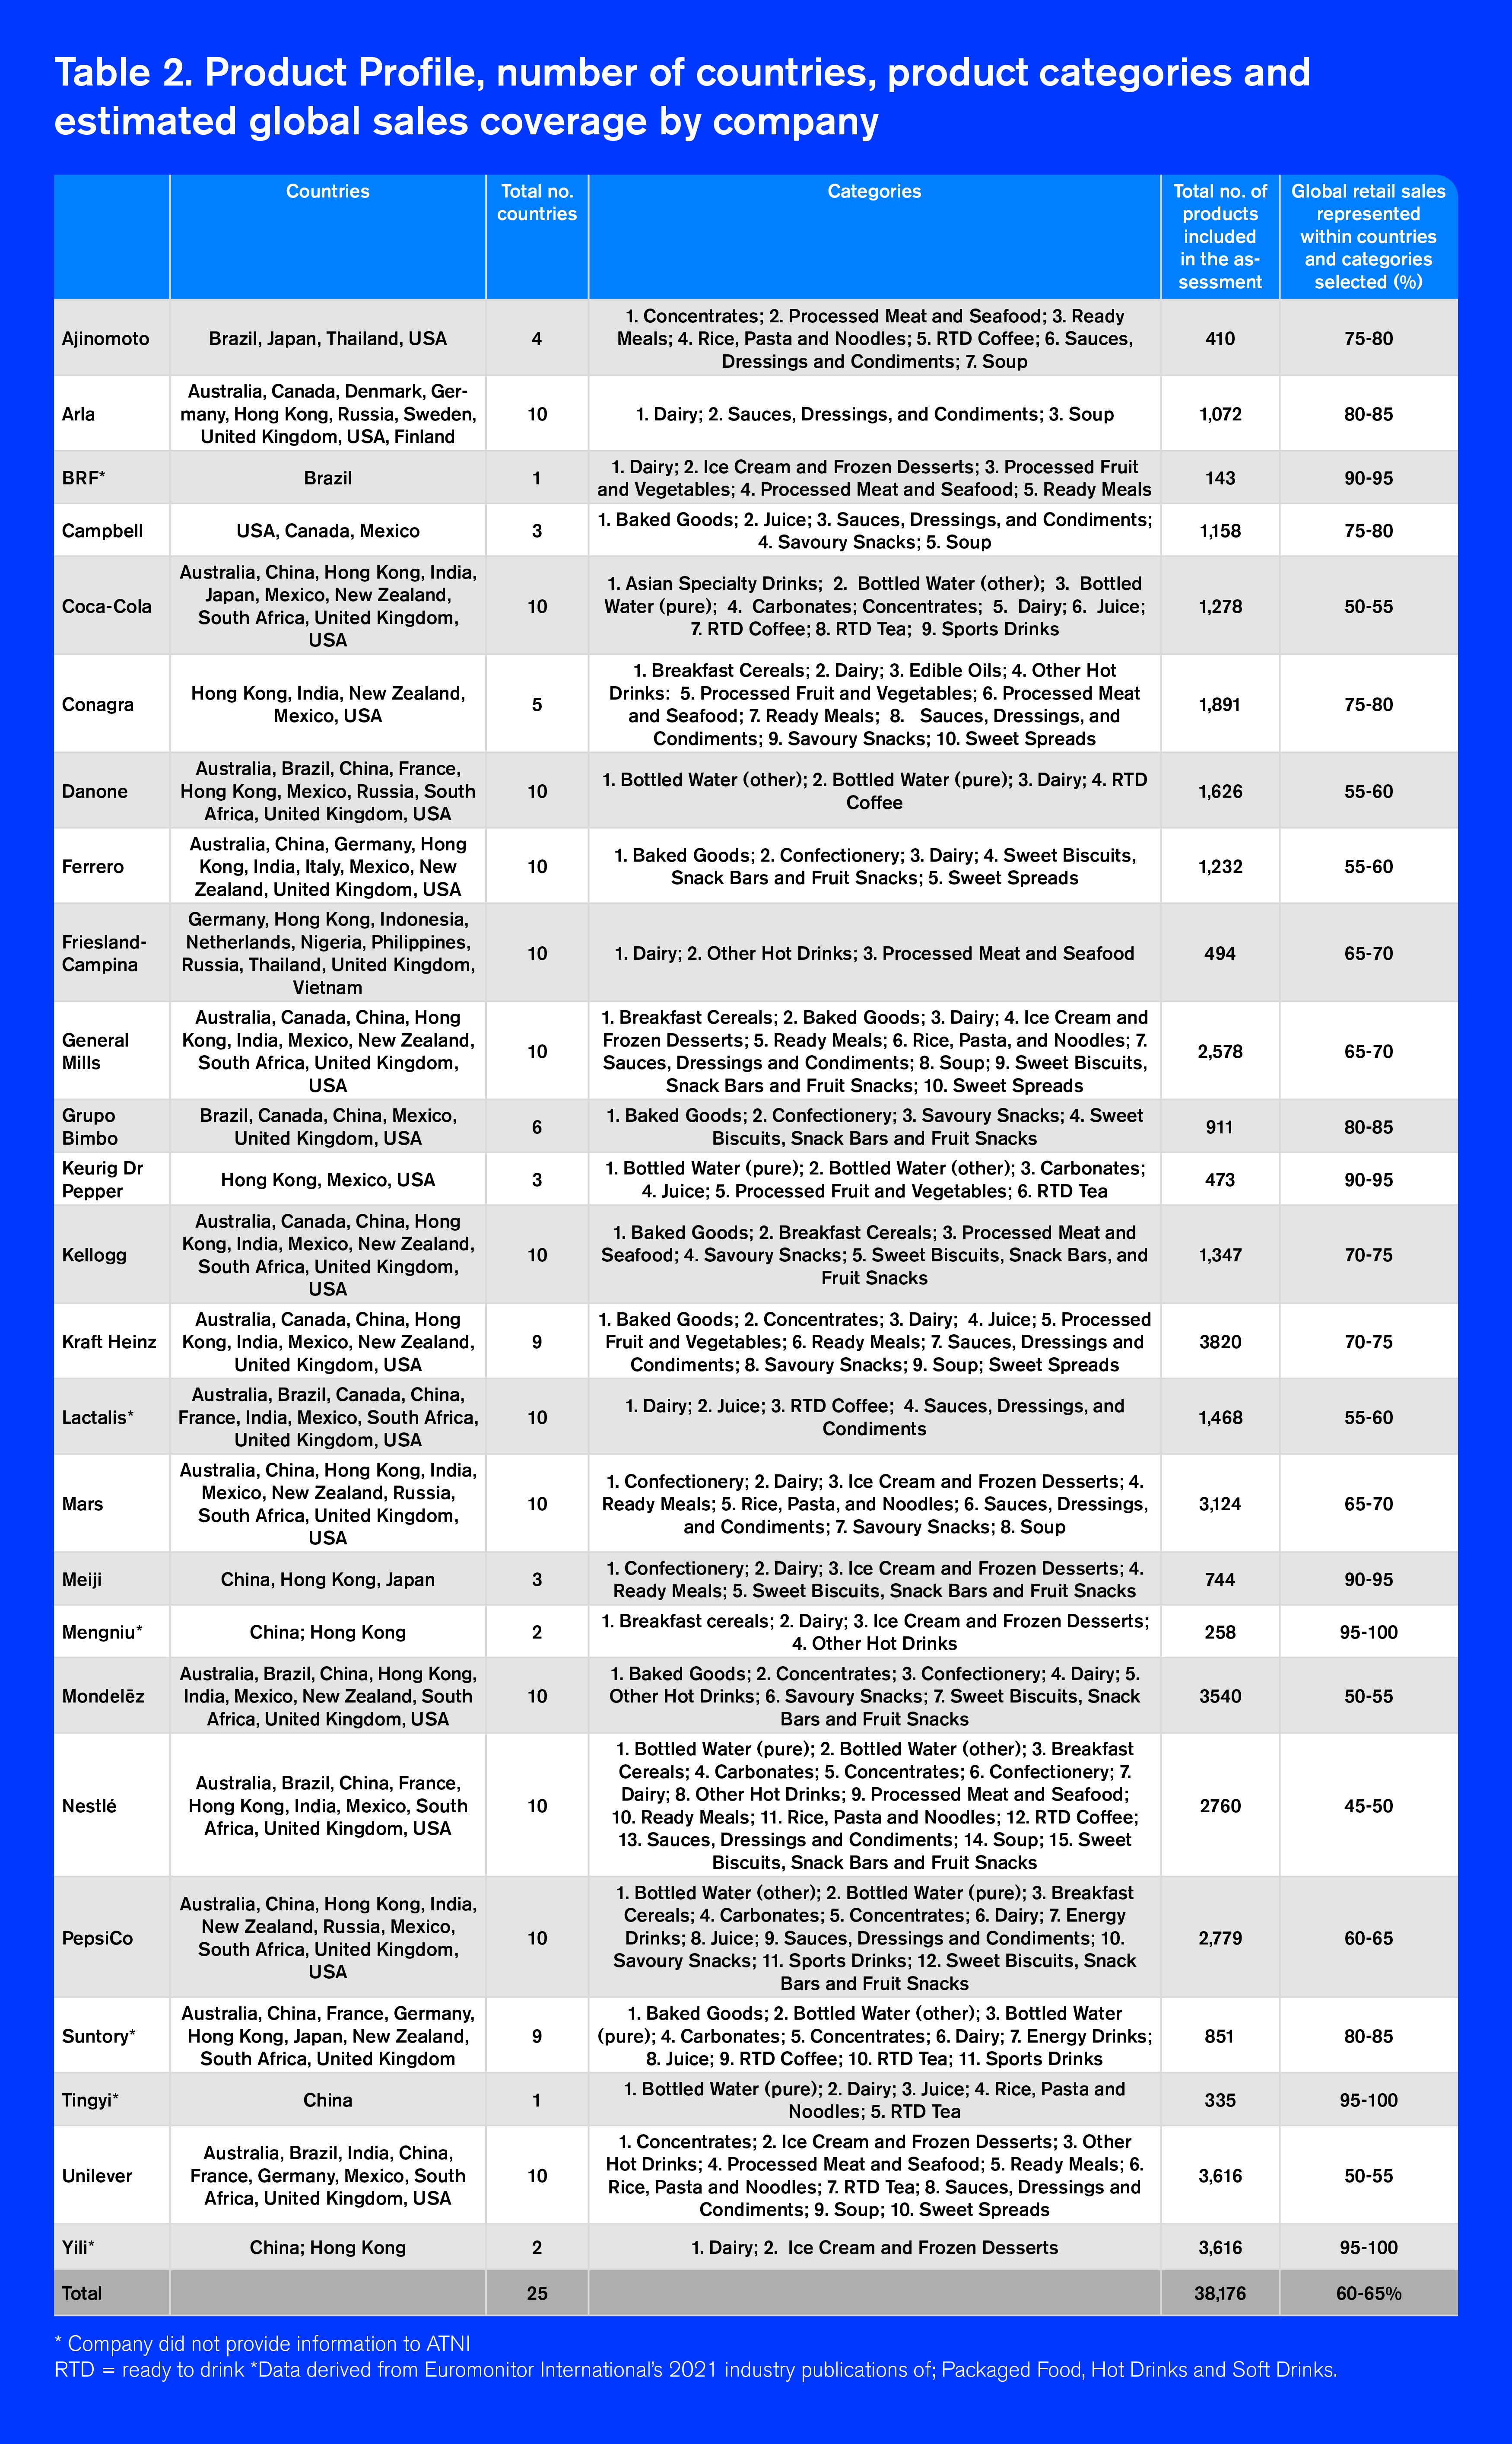
See Table 1 in AnnexThe products assessed in the Product Profile account for over 60% of the global retail sales in 2019 for all 25 companies combined. Table 2 (in Annex) shows the range of retail sales coverage for each company. It is important to note that for Coca-Cola, Danone, Ferrero, Lactalis, Mondelez and Unilever between 50-60% of the companies’ 2019 global retail sales are covered in the Product Profile within the countries and categories in scope (i.e., excluding coffee and packaged tea, and limiting to the top five best-selling categories for each market selected in the assessment). For Nestlé, the Product Profile covers between 45-50% of the company’s estimated 2019 retail sales, as the company has a very diversified product portfolio and is active in numerous markets. For the rest of the companies, the Product Profile accounts for 60% or more of their estimated 2019 global retail sales.
ATNI’s Product Profile 2021 is composed of three scored elements:
B1.1 Portfolio mean healthiness score. This represents the nutritional quality of companies’ overall product portfolios in major markets. A score of 10 means the company derives its sales only from ‘healthy’ products.
B1.2 Within product category score. Companies have the potential to make a positive impact by providing healthier options within categories. In product categories in which two or more companies are active, a performance score is calculated based on the company mean HSR in that category compared to peers. A score of 10 means a company has, on average, the ‘healthiest’ products in selected categories compared to peers.
B1.3 Change over time in mean HSR score. This element quantifies the rate of improvement in portfolio ‘healthiness’, based on the difference in the companies’ overall sales-weighted mean HSR score between 2018 and 2021. It only applies to companies assessed in both Product Profiles and takes into account only those countries included in both assessments.
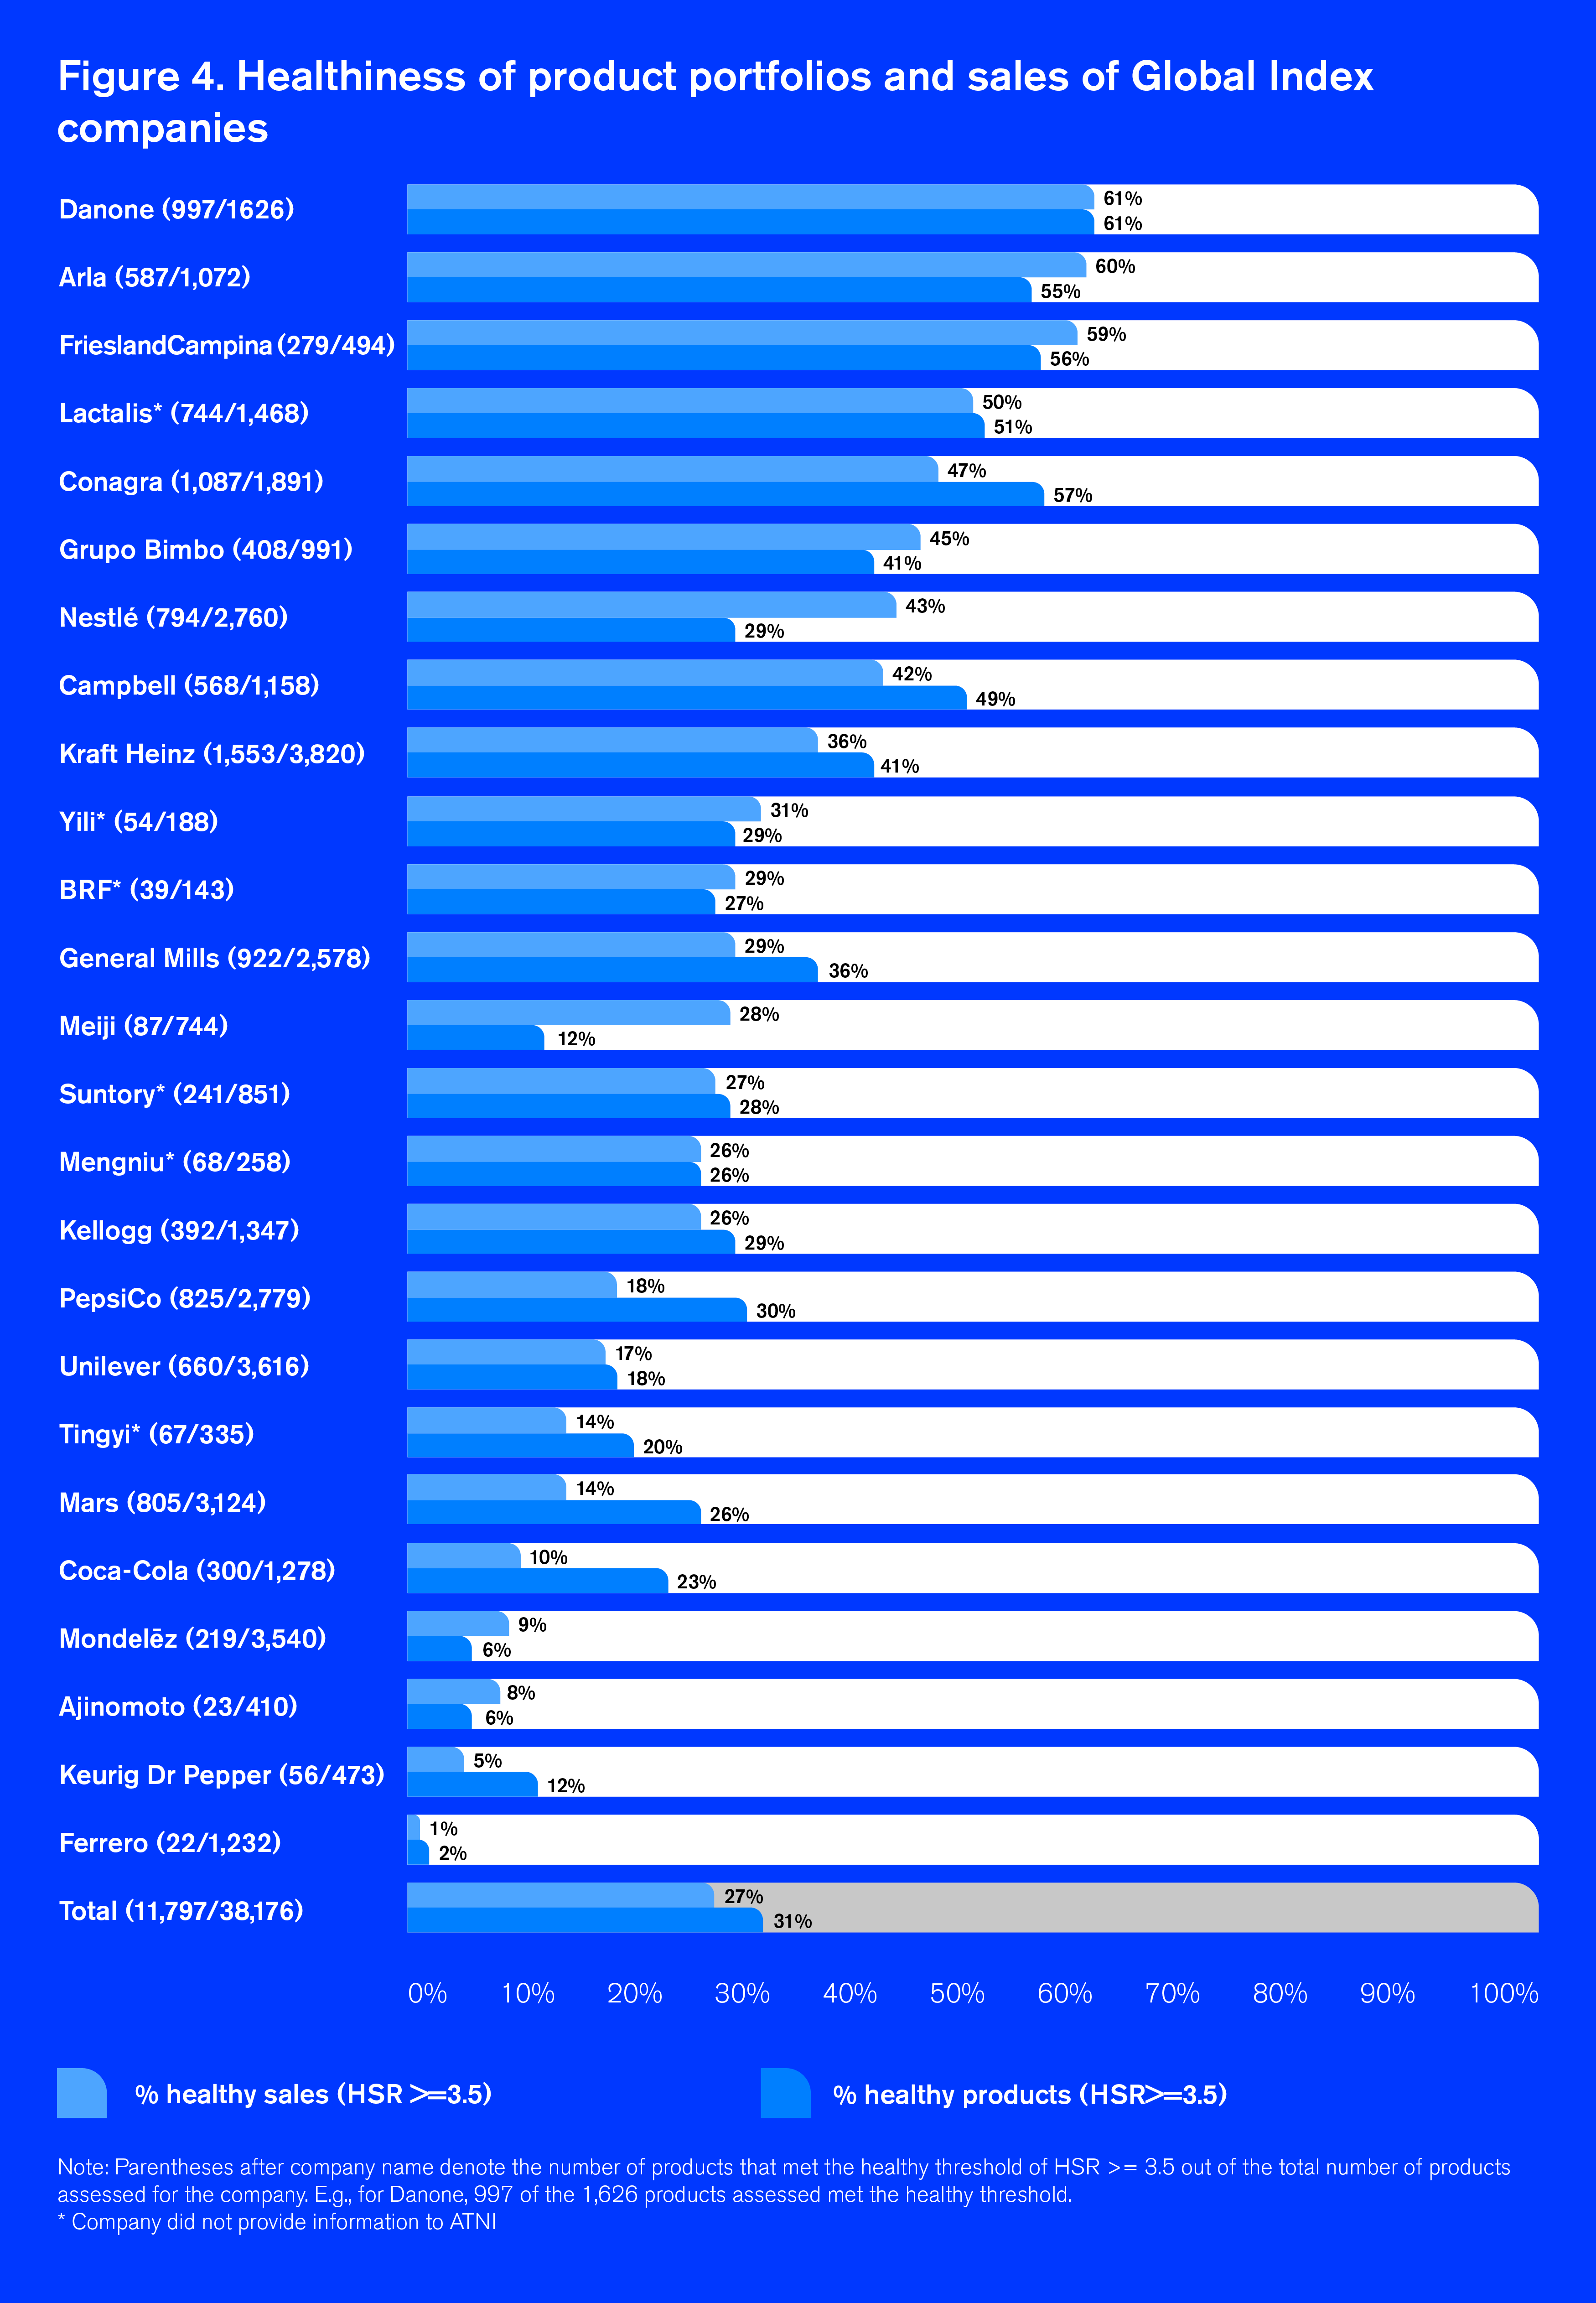
Overall, 31% of products assessed in the Product Profile (11,797 out of 38,176) for all companies combined met the healthy threshold of HSR>=3.5. This is the same proportion found in the Global Index 2018 Product Profile (when less products were assessed in less markets).
Five companies (Arla, Danone, ConAgra, FrieslandCampina, and Lactalis) have a product portfolio in which more than 50% of distinct products meet the healthy threshold. Mondelez, Ajinomoto and Ferrero are estimated to have less than 10% of distinct products in their portfolio that can be considered healthy. These results show most companies are still falling short in supplying healthier alternatives globally. Please see Figure 4 (in Annex).
See Figure 4 in AnnexTaking into account the sales values of products, nine companies were found to derive more sales from healthy products (HSR>=3.5) compared to less healthy options (HSR<3.5). Only four companies (Arla, Danone, FrieslandCampina, and Lactalis) were found to derive half or more of their sales captured in the Product Profile from healthy products.
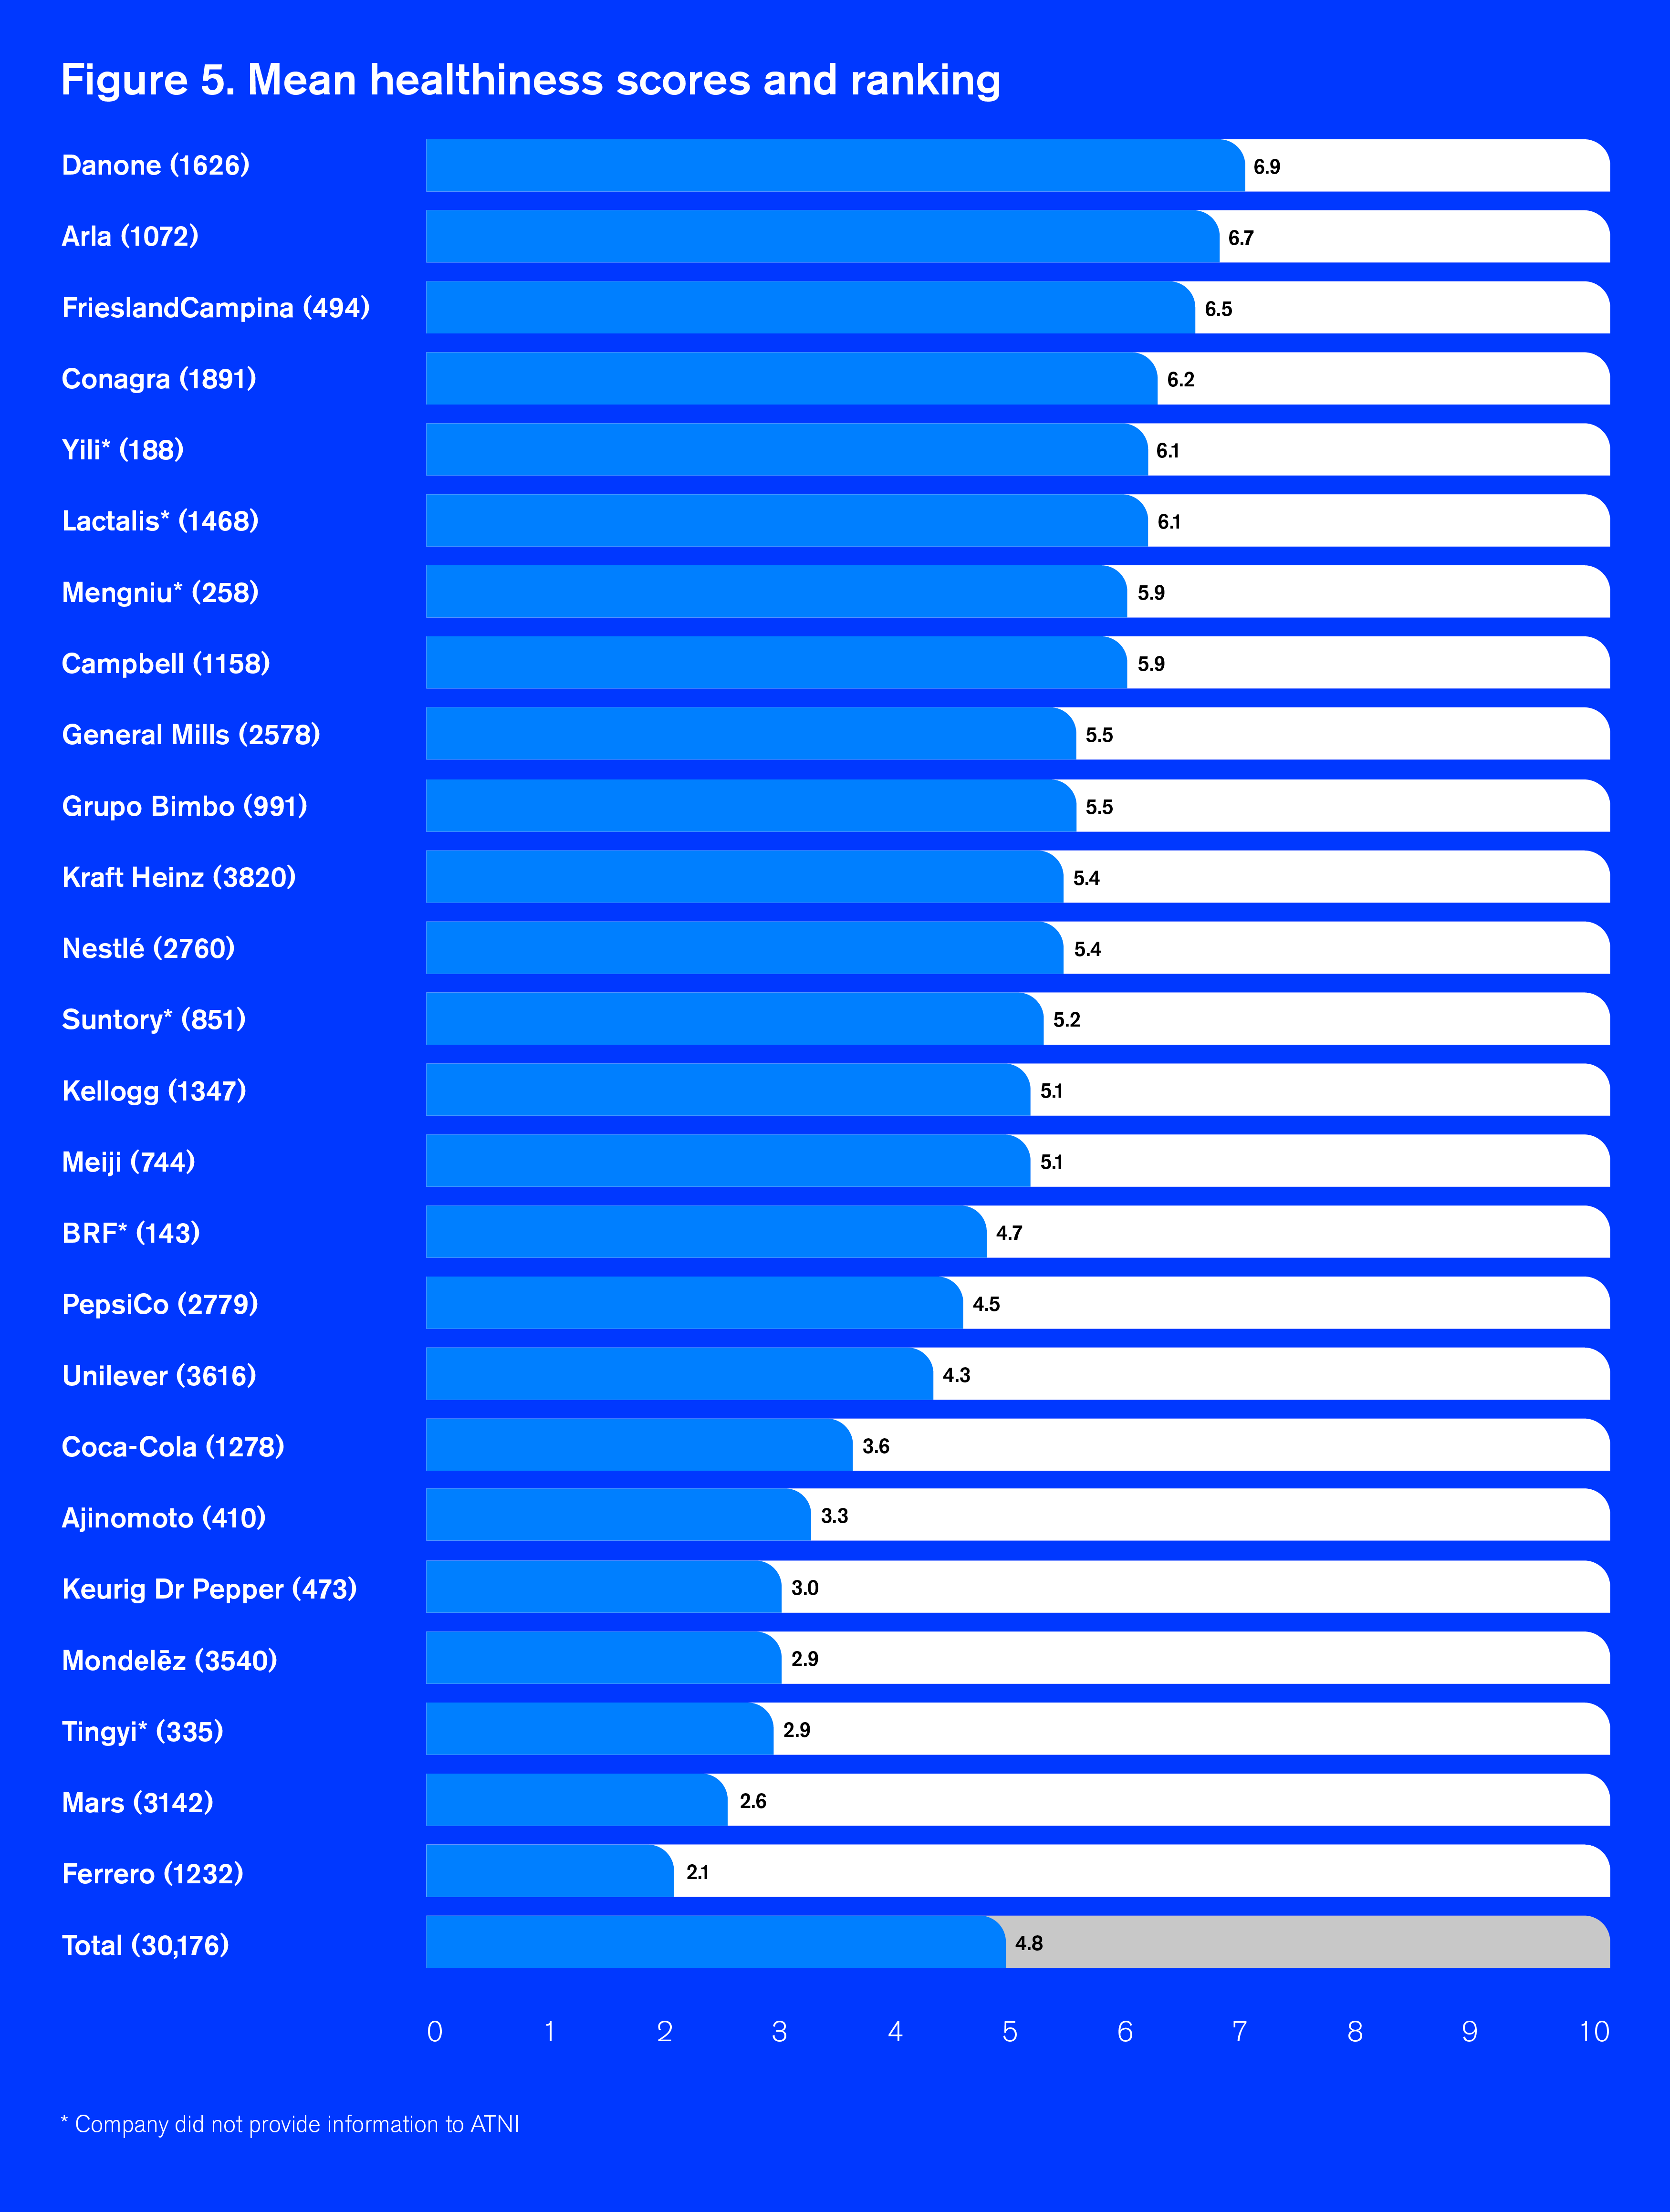
The mean sales-weighted HSRs at portfolio-level for companies ranged from 1.0 to 3.5 (out of 5.0). The mean HSR for all companies combined was 2.4 (out of 5.0). ATNI turns this into a healthiness score between 1 and 10 (by doubling the star rating) resulting in a healthiness score 4.8 out of 10, as illustrated in figure 5 (below).
Danone, Arla and FrieslandCampina show the highest overall mean HSR taking into account sales values. Danone is the only Index company to achieve an overall mean HSR of 3.5 out of 5 — meeting the healthy threshold — which translates into a mean healthiness score of 6.9 out of 10. Sales are taken to apply a weighting that is most relevant for health impact (assuming sales correlate with consumption), as well as company commercial value.
Figure 5 below shows that mean healthiness scores and ranking of companies, and in brackets the number of products assessed.
The composition of companies’ product portfolios varies widely. Three of the Index companies primarily sell beverages (Coca-Cola, Keurig Dr Pepper and Suntory), six companies primarily sell dairy products (Arla, Mengniu, Danone, Lactalis, FrieslandCampina and Yili), and three companies derive majority of their global sales from confectionery (Ferrero, Mars and Mondelez). This second scored element in the Product Profile has been introduced to encourage companies to develop healthier products within categories irrespective of their overall portfolio composition.
In product categories in which two or more companies are active, a performance score is calculated based on the company’s category mean HSR (average nutritional quality of products assessed within a category) compared to peers.
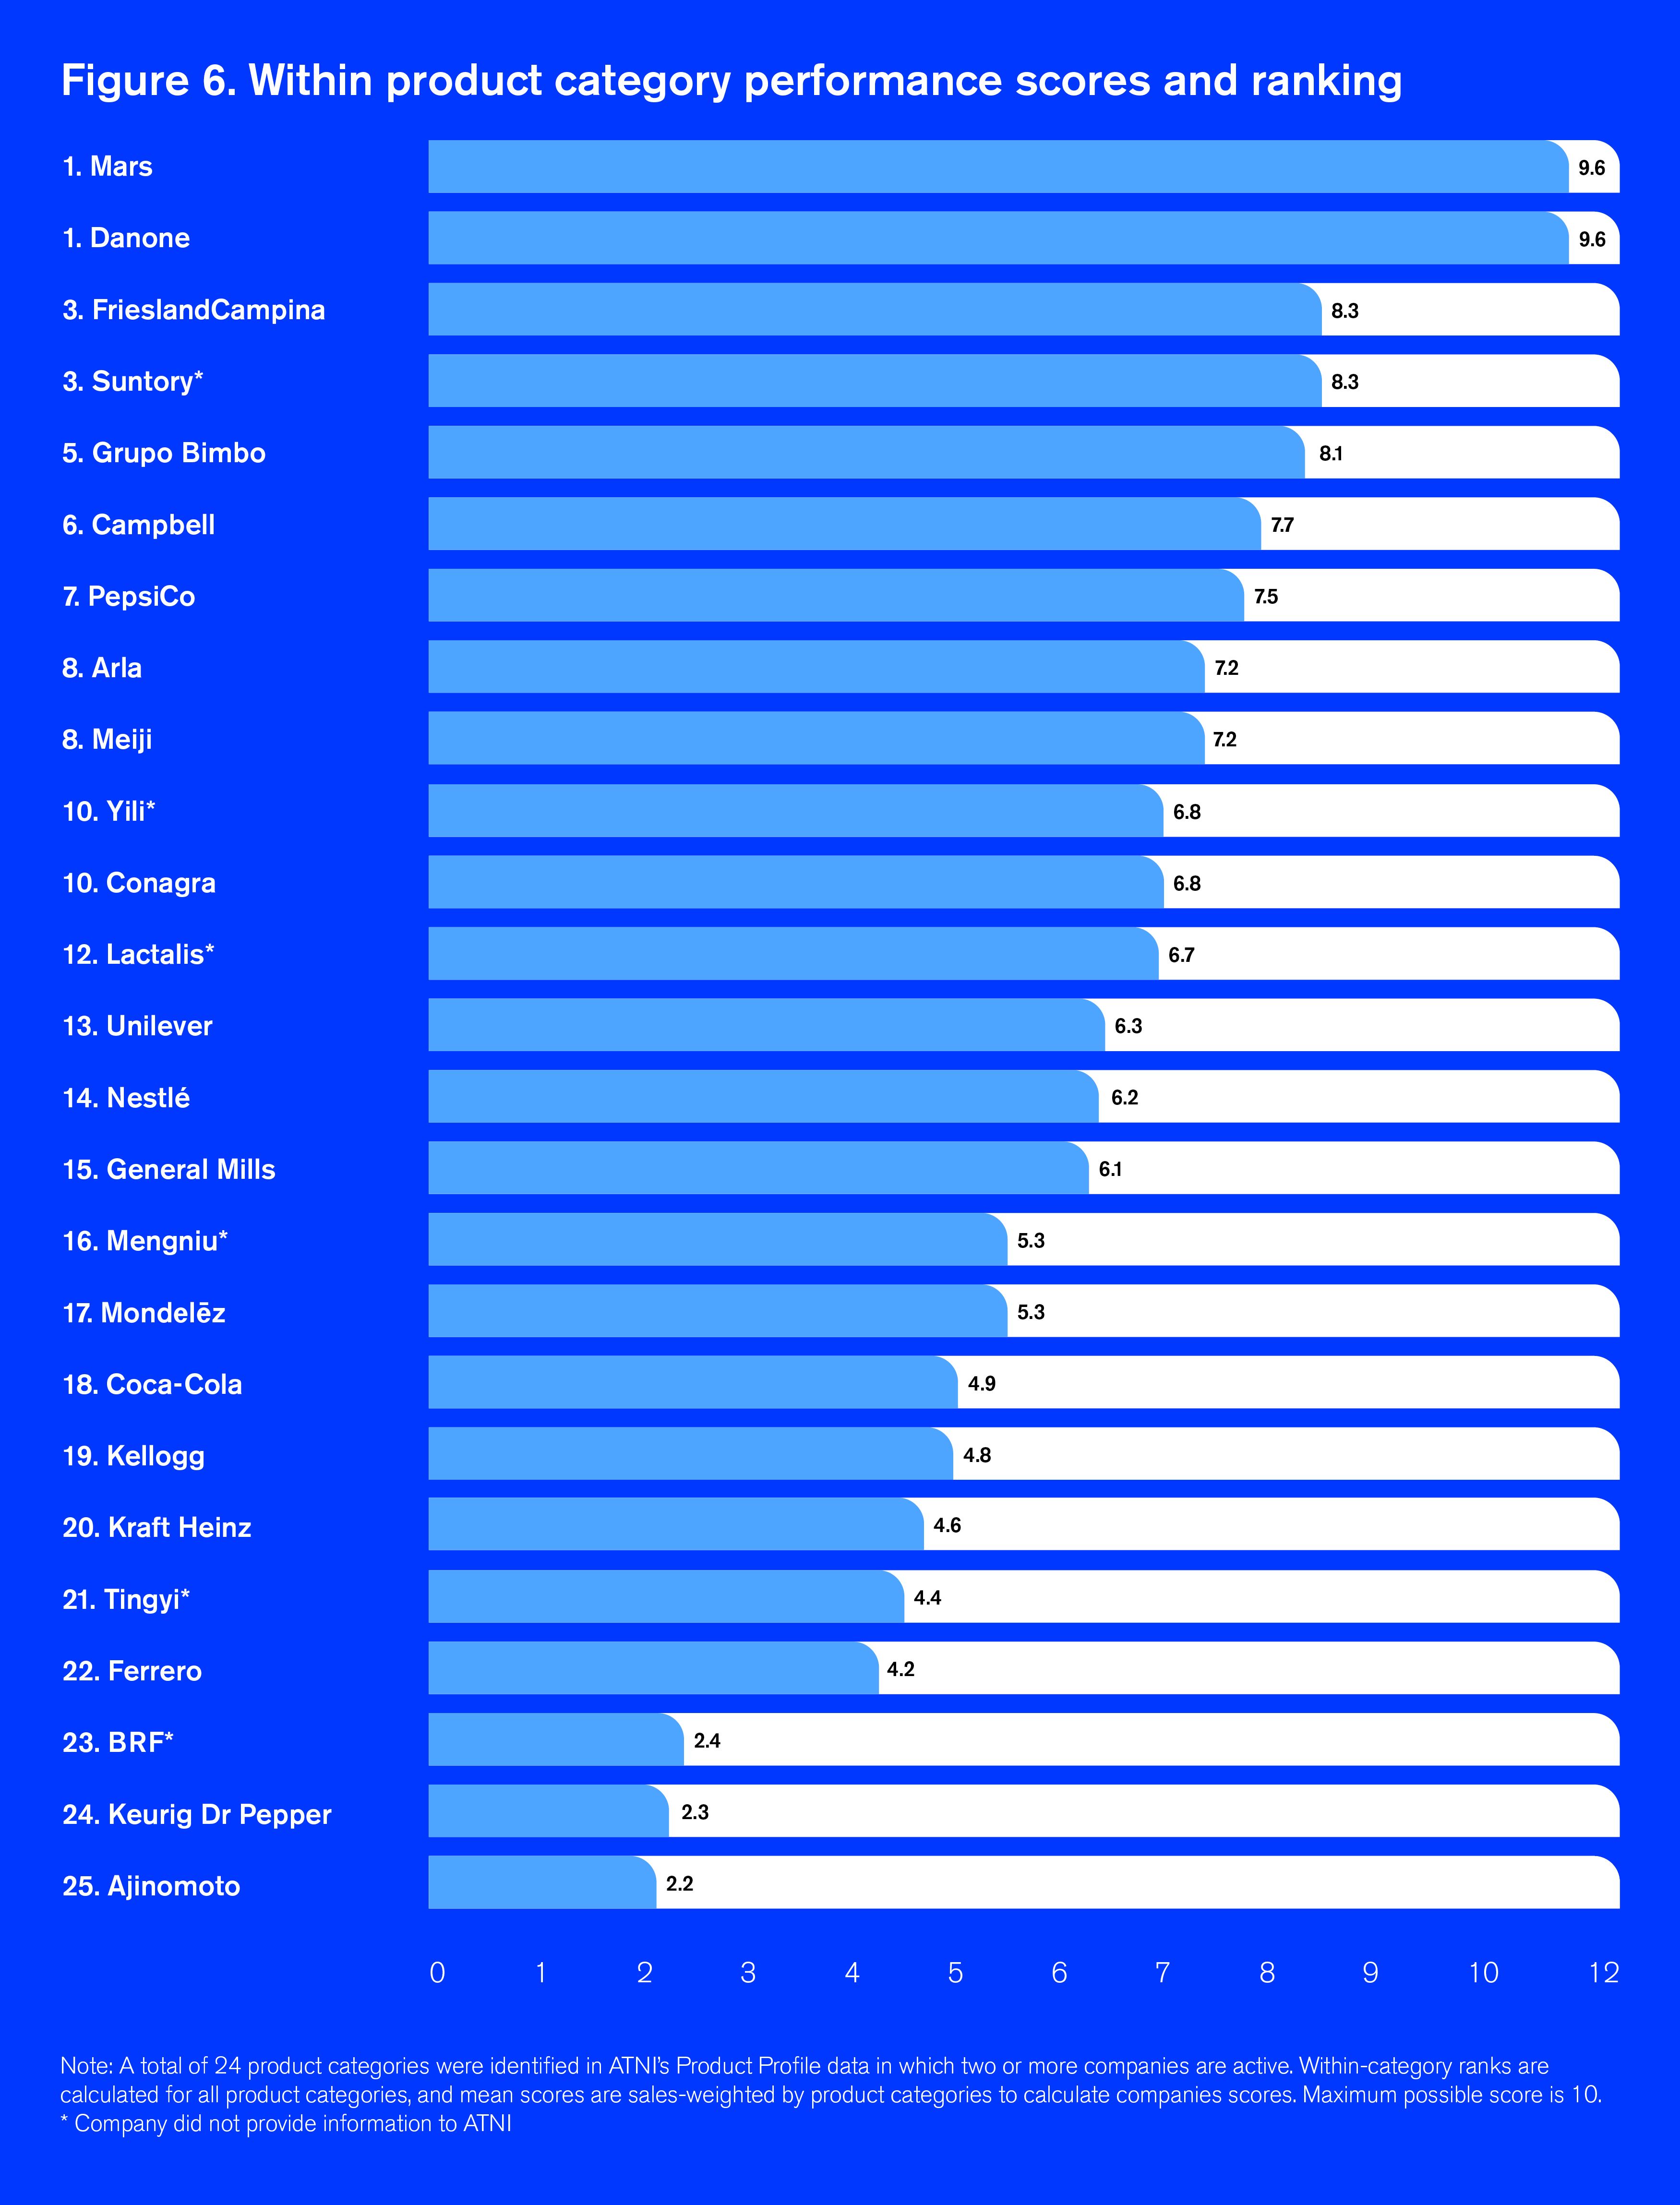
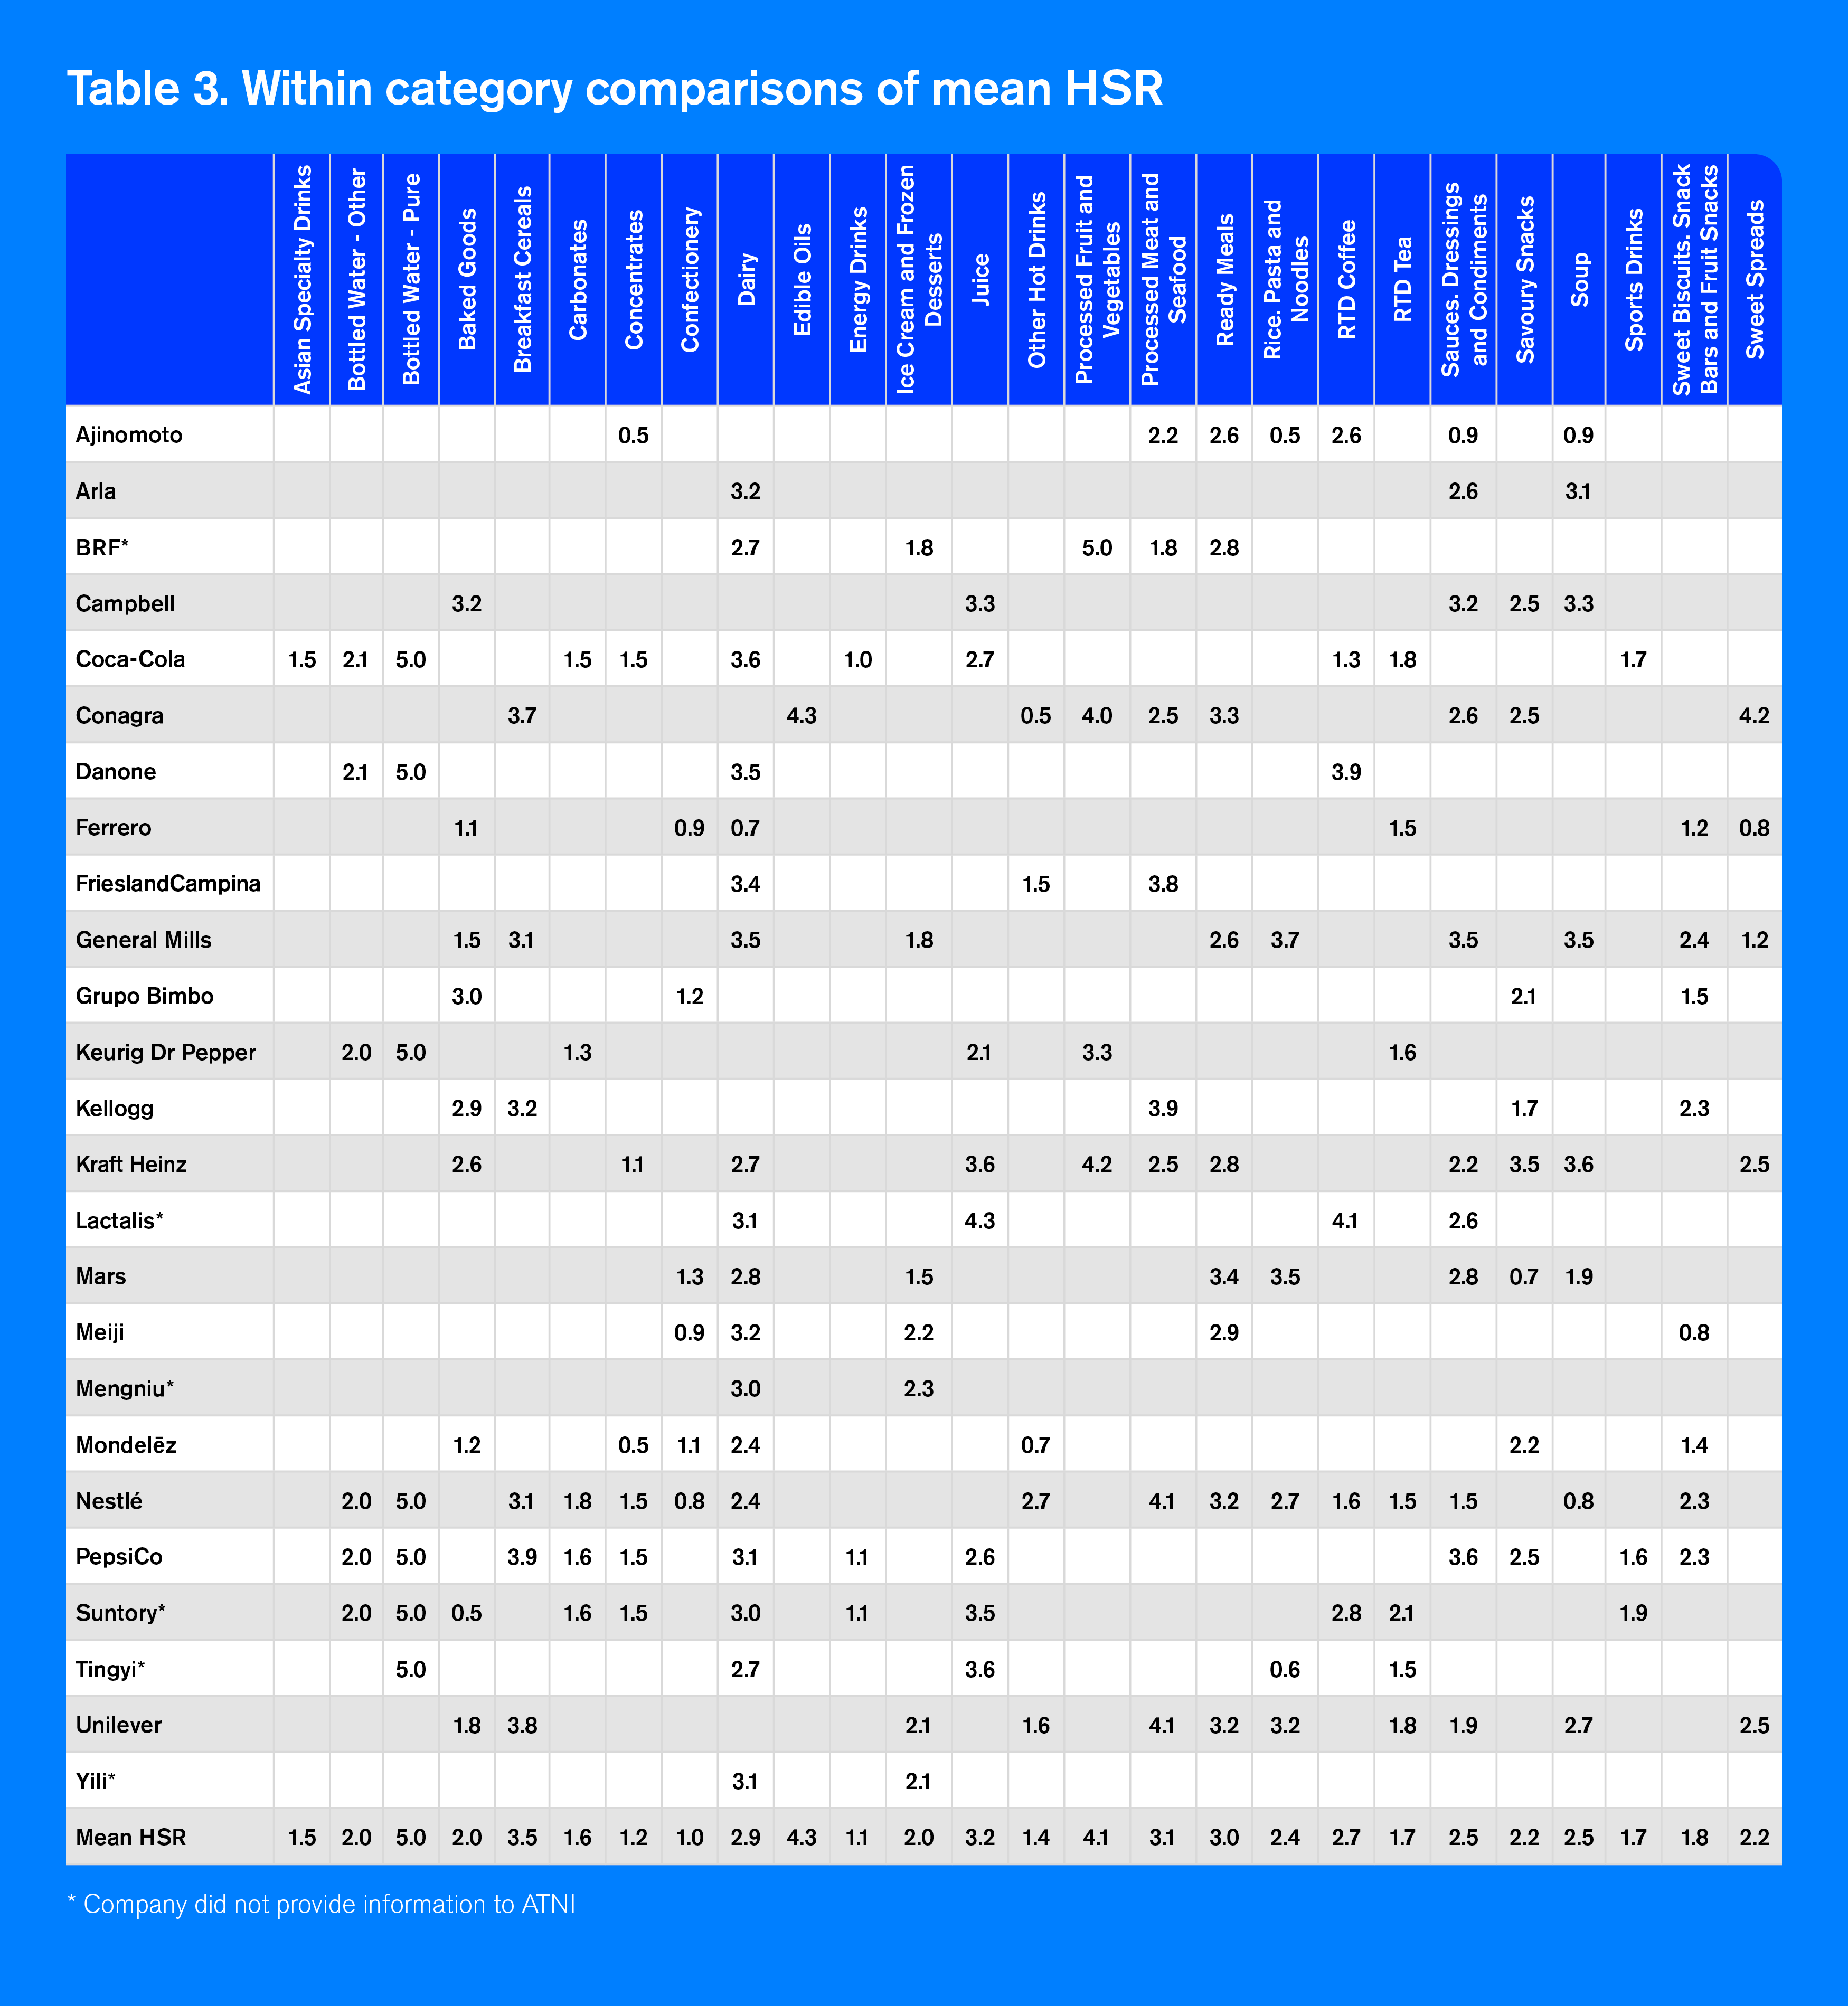
Danone and Mars achieve the highest score (9.6 out of 10) in this element of the Product Profile. Table 3 shows Mars is assessed across eight product categories in which it competes with one or more peers, and ranks first in ‘Confectionery’ and ‘Ready Meals’, and second in ‘Rice, Pasta and Noodles.’ Danone is assessed across four categories, and achieves a shared first rank in ‘Bottled water- pure,’ ranks first in ‘Bottled Water -other’ and second in ‘Dairy’ and ‘Ready-to-drink Coffee.’
See Figure 6 in AnnexFrieslandCampina, Suntory and Grupo Bimbo also perform relatively well compared to peers in the same product categories (see table 3). FrieslandCampina ranks third in the ‘Dairy’ category, with the company’s 484 Dairy products assessed across 10 markets achieving a mean HSR of 3.4 out of 5. This is well above the category average of 2.9. For Suntory, its ‘Ready-to-drink Tea’ category achieves the highest mean HSR of 2.1, compared to seven other companies also assessed. Despite this finding, a mean HSR of 2.1 is considered low, and reflects the fact most Ready-to-drink teas still contain unhealthy levels of added sugar.
Table 3 (in Annex) shows there are significant differences in the mean HSR of company products within product categories. For example, in ‘Sweet Spreads’, Conagra’s 14 analyzed products achieved the highest mean HSR score of 4.2 out of 5, while Ferrero’s 16 products achieved a mean HSR score of just 0.8.
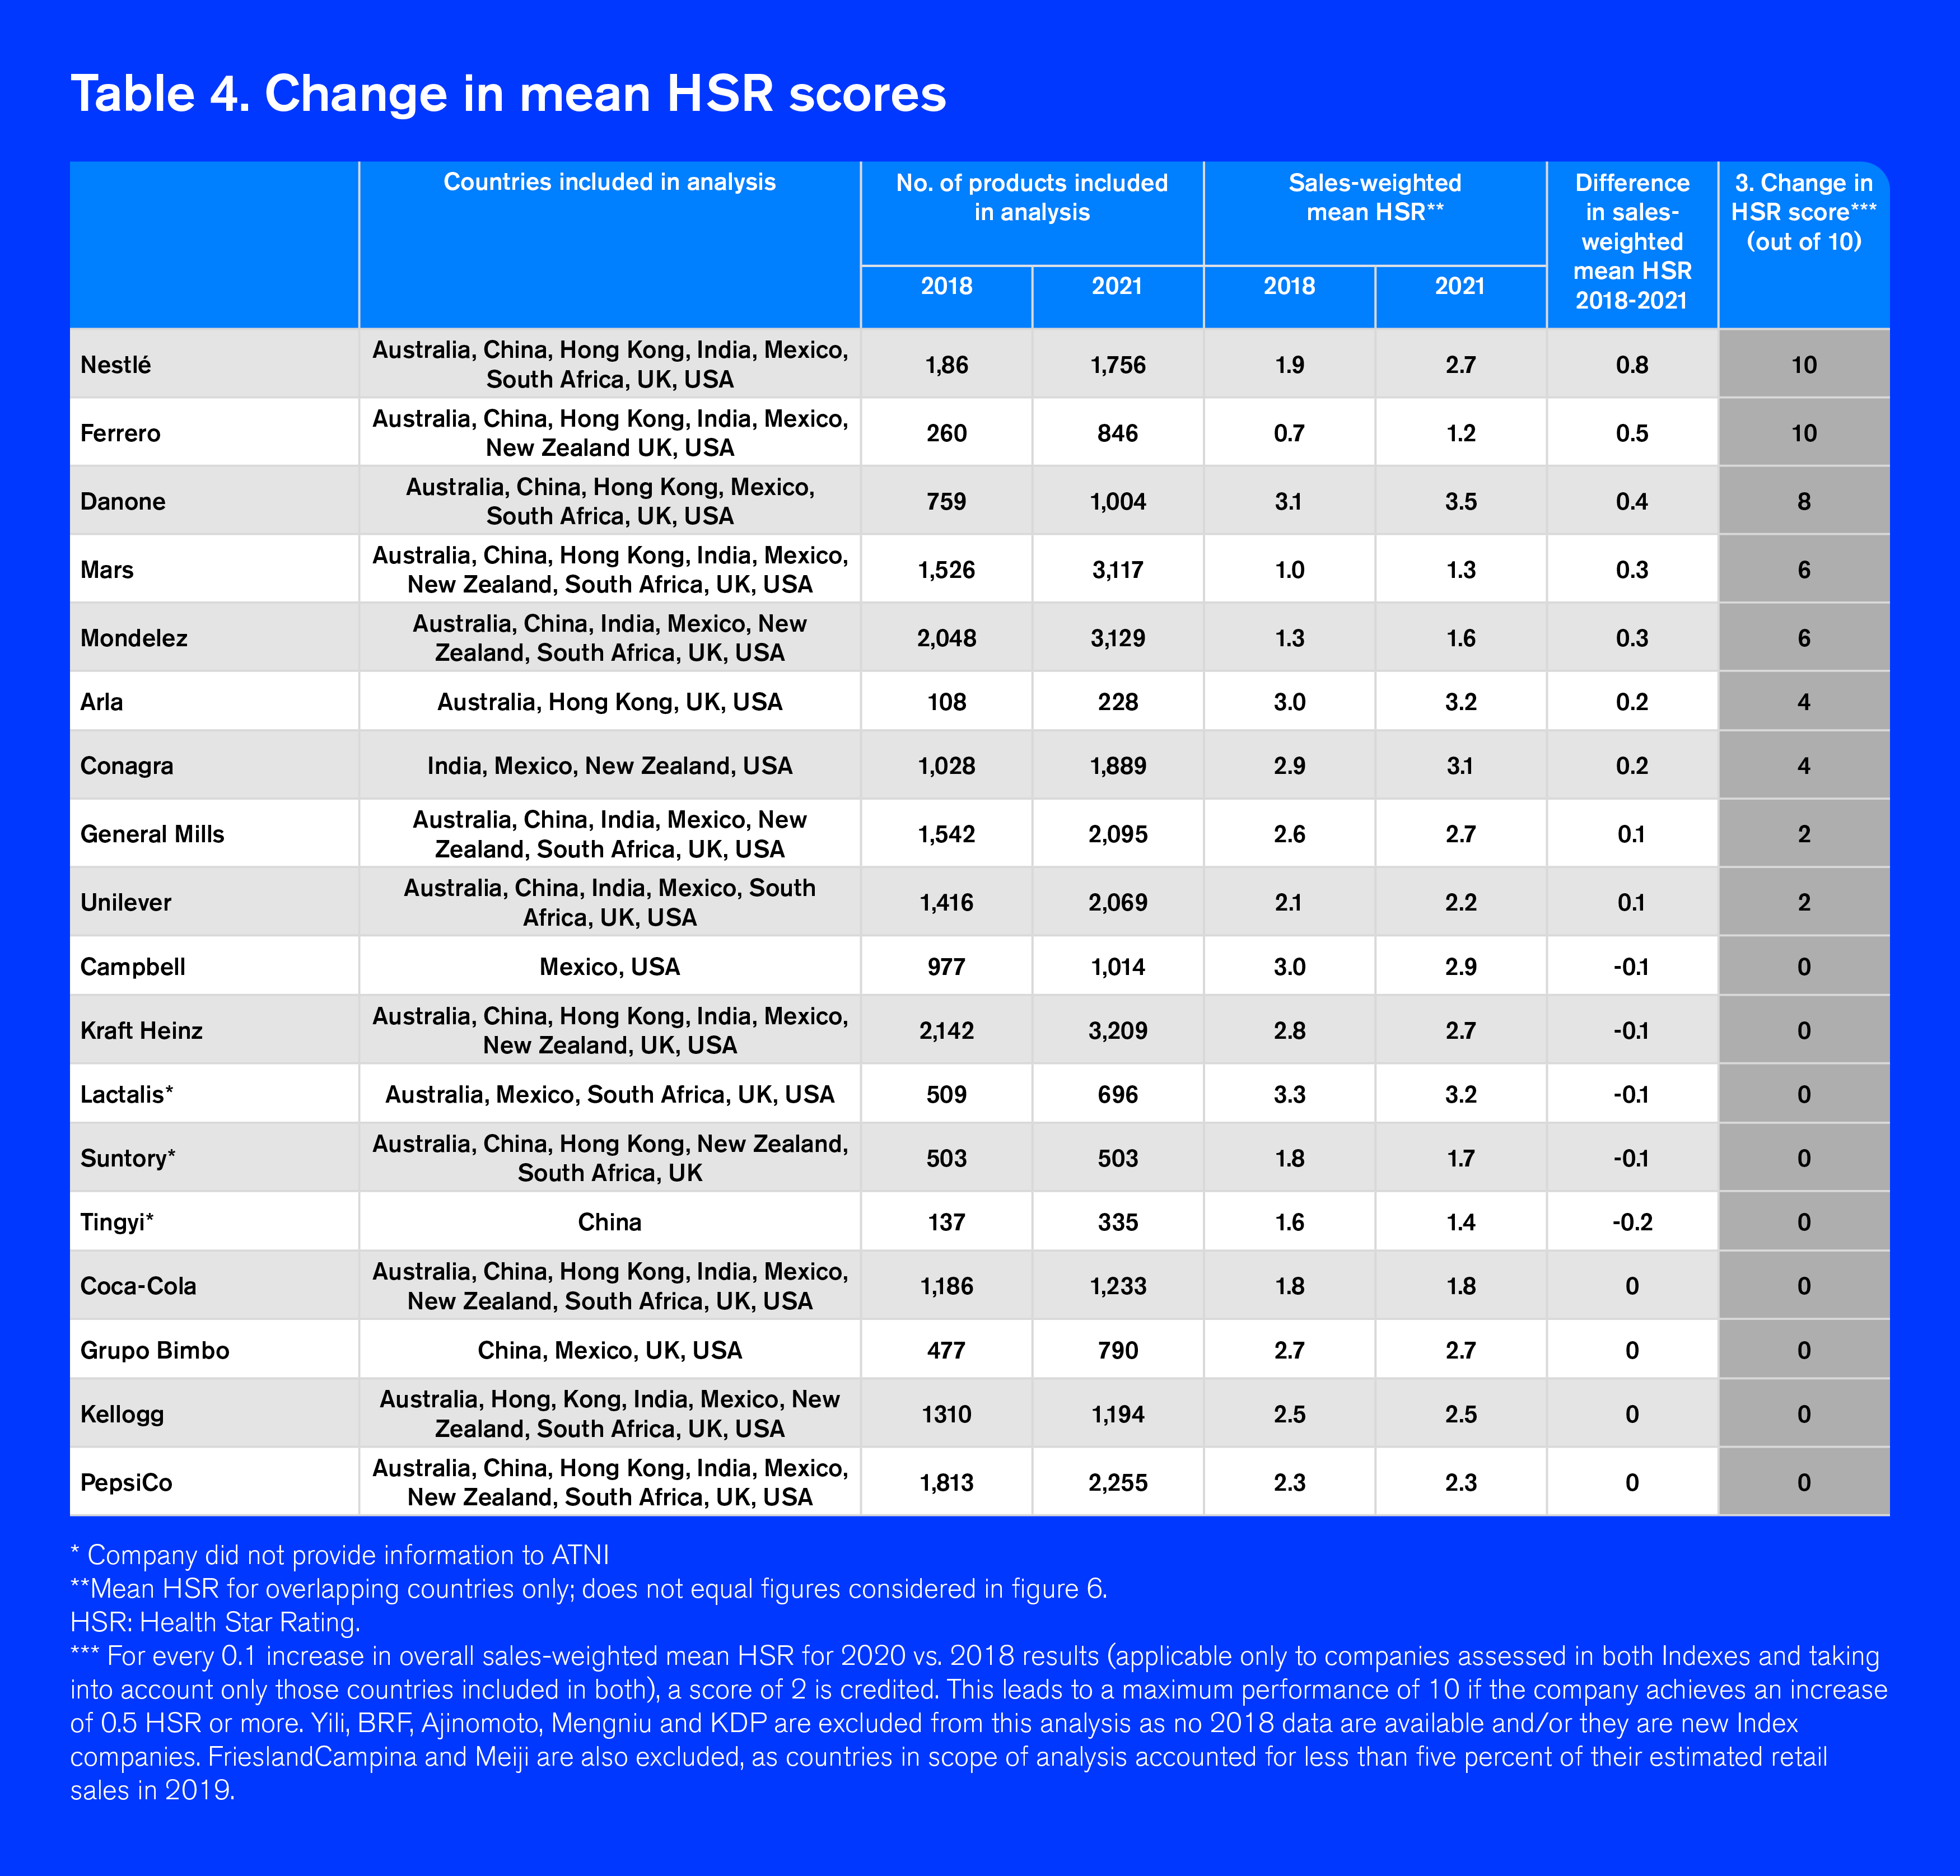
See Table 3 in AnnexIn this third scored element of the Product Profile, for every 0.1 increase in overall sales-weighted mean HSR between 2018 and 2021, a score of two is credited; leading to a maximum performance of 10 if the company achieves an increase of 0.5 HSR or more. The products from 18 companies for which data were available in both Global Index 2018 Product Profile and Global Index 2021 Product Profile were included in this analysis. Results are shown in table 4 (below). 9 out of these 18 companies showed an improved mean HSR and therefore received a score. The other companies did not receive a score as their mean HSR showed a slight decrease or remained the same.
Companies can make a positive impact by accelerating their innovation and reformulation strategies, as well as acquisitions of healthy products and divestments of unhealthier product lines. This change analysis relies on the quality of information available in both years, and it is important to highlight that this change might not be a precise representation of companies’ reformulation efforts over time. Instead, this analysis captures the differences over time of sales at category level as well as change in overall portfolio compositions.
Nine companies show an increase in mean HSR:
- Nestlé showed the largest increase in mean HSR between the 2018 and 2021 Product Profile (mean HSR=1.9 to 2.7), with eight countries included in both assessments. The large increase observed in mean HSR is partially attributed to some key changes in category sales. For example, the proportion of sales derived from the ‘Dairy’ category increased from 19% to 24%, and ‘Confectionery’ sales decreased from 21% to 15%. Of the eight countries included in this analysis, HSR increased the most for the USA, because the company divested its ‘Confectionery’ and ‘Ice Cream’ businesses there. The USA is the largest market for Nestlé among the countries included in analysis, so these divestments had a profound effect on overall results.
- Between 2018 and 2021, Ferrero showed an increase in mean HSR when examining the same countries in both Product Profiles (mean HSR=0.7 to 1.2) — largely driven by the acquisition of biscuit and fruit snack brands in the USA. Despite this improvement, Ferrero still had one of the lowest mean healthiness scores among companies assessed in both 2018 and 2021.
- For Danone, changes to the healthiness and proportion of sales from the ‘Dairy’ category, across most countries and overall, have driven its mean HSR improvement. It is important to note that ATNI follows Euromonitor International category classifications and, for Dairy, this also includes plant-based products (including former WhiteWave brands).
- The increase observed for Mars in mean HSR (1.0 to 1.3) between 2018 and 2021, when examining the same countries included in both Global Index Product Profile reports , cannot be attributed to sale changes at category-level. Instead, it’s most likely due to an increase in mean HSR of ‘Confectionery’ products in the USA and the fact that the company provided feedback on product listings and nutrient information in 2021 (but not in 2018). Despite this improvement, Mars still had the second lowest mean healthiness score in the 2021 Product Profile.
- For Mondelez, ‘Confectionery’ had a higher overall mean HSR in 2021 compared to 2018.
- For Arla, no major differences in category-level sales were observed, as only one category (Dairy) was included in both the 2018 and 2021 assessments. For Arla, the change appears to be driven solely by an increase in the mean HSR for UK ‘Dairy’ products with a larger number of yogurt products included in 2021 versus 2018.
- Conagra’s increase in the four countries for which data were available in both 2018 and 2021 is partly explained by the increase in the proportion of sales from ‘Processed Fruit and Vegetables.’
- General Mills performance is linked to a few category changes. For example, products in the ‘Baked Goods’ category had less weight in the 2021 assessment, while products from the ‘Soup’ category contributed more to the sales-weighted mean HSR results.
- Finally, Unilever also showed an increase in mean HSR between the 2018 and 2021 Product Profile, based on the seven countries included in both assessments (mean HSR=2.1 to 2.2; see table 4). Unilever’s performance is linked to a few category changes. For example, the ‘RTD Tea’ represented a much larger proportion of sales in 2018 versus 2021, and ‘Sauces, Dressings and Condiments’, a much smaller proportion in 2018 versus 2021.
More information on companies’ performances can be found in their individual scorecards Product Profile section and the full Product Profile 2021 report.
ATNI has published a new research paper with an analysis of potential inequities in the nutritional quality of the 25 companies’ product portfolios across 11 markets and 26 product categories.
Read the full reportProduct Profile results illustrate that companies can — and must — do much more to improve the overall nutritional quality of their product portfolios and accelerate efforts to derive more sales from healthy options. ATNI encourages global food and beverage manufacturers to:
- Enhance efforts to improve the healthiness of product portfolios (g., through improved reformulation or acquisitions/divestments with a focus on nutrition).
- Support government reformulation initiatives and define SMART (Specific, Measurable, Achievable, Relevant, and Time-bound) targets for key nutrients critical to public health — such as reductions in sodium — and improve accountability through better reporting.
- Provide more nutrition information on labels. The information should, at minimum, align with Codex Alimentarius standards (see Category F on Labeling).
- Engage with ATNI to further improve the accuracy and comprehensiveness of the Product Profile.
B2: Product formulation
ATNI’s Product Profile results show how companies have significant scope to better support consumers in making healthier choices by improving the nutritional quality of foods. This criterion addresses companies’ efforts to do so through new product development/formulation and reformulation strategies, to address all forms of malnutrition, including micronutrient deficiencies.
While companies’ transparency about the healthiness of their products has not improved significantly since 2018, eight companies publicly disclose the number of products that meet their healthy criteria. This allows for comparison with the ATNI Product Profile results and better understanding of the nutritional quality of companies’ overall portfolios. ATNI encourages companies to adopt a government-endorsed NPM and publish how the internal model used aligns with external standards.
————————————————————————————————————–
Companies’ definition of ‘healthy’ vs. external benchmarks
The 2021 Global Index methodology includes a new indicator to track whether companies’ nutrient profiling models, or other systems used to define healthy products, are aligned with external standards — specifically the HSR, as it is the model used in ATNI’s Product Profile. Index results show seven companies have conducted such exercises, but only Danone, Unilever, Frieslandcampina and Grupo Bimbo provide relevant information in the public domain. Arla, FrieslandCampina and Danone showed evidence that their definition of healthy products corresponds with the HSR >=3.5 definition of ‘healthy’ (with less than 10% deviation in estimated percentage of ‘healthy’ products).
————————————————————————————————————–
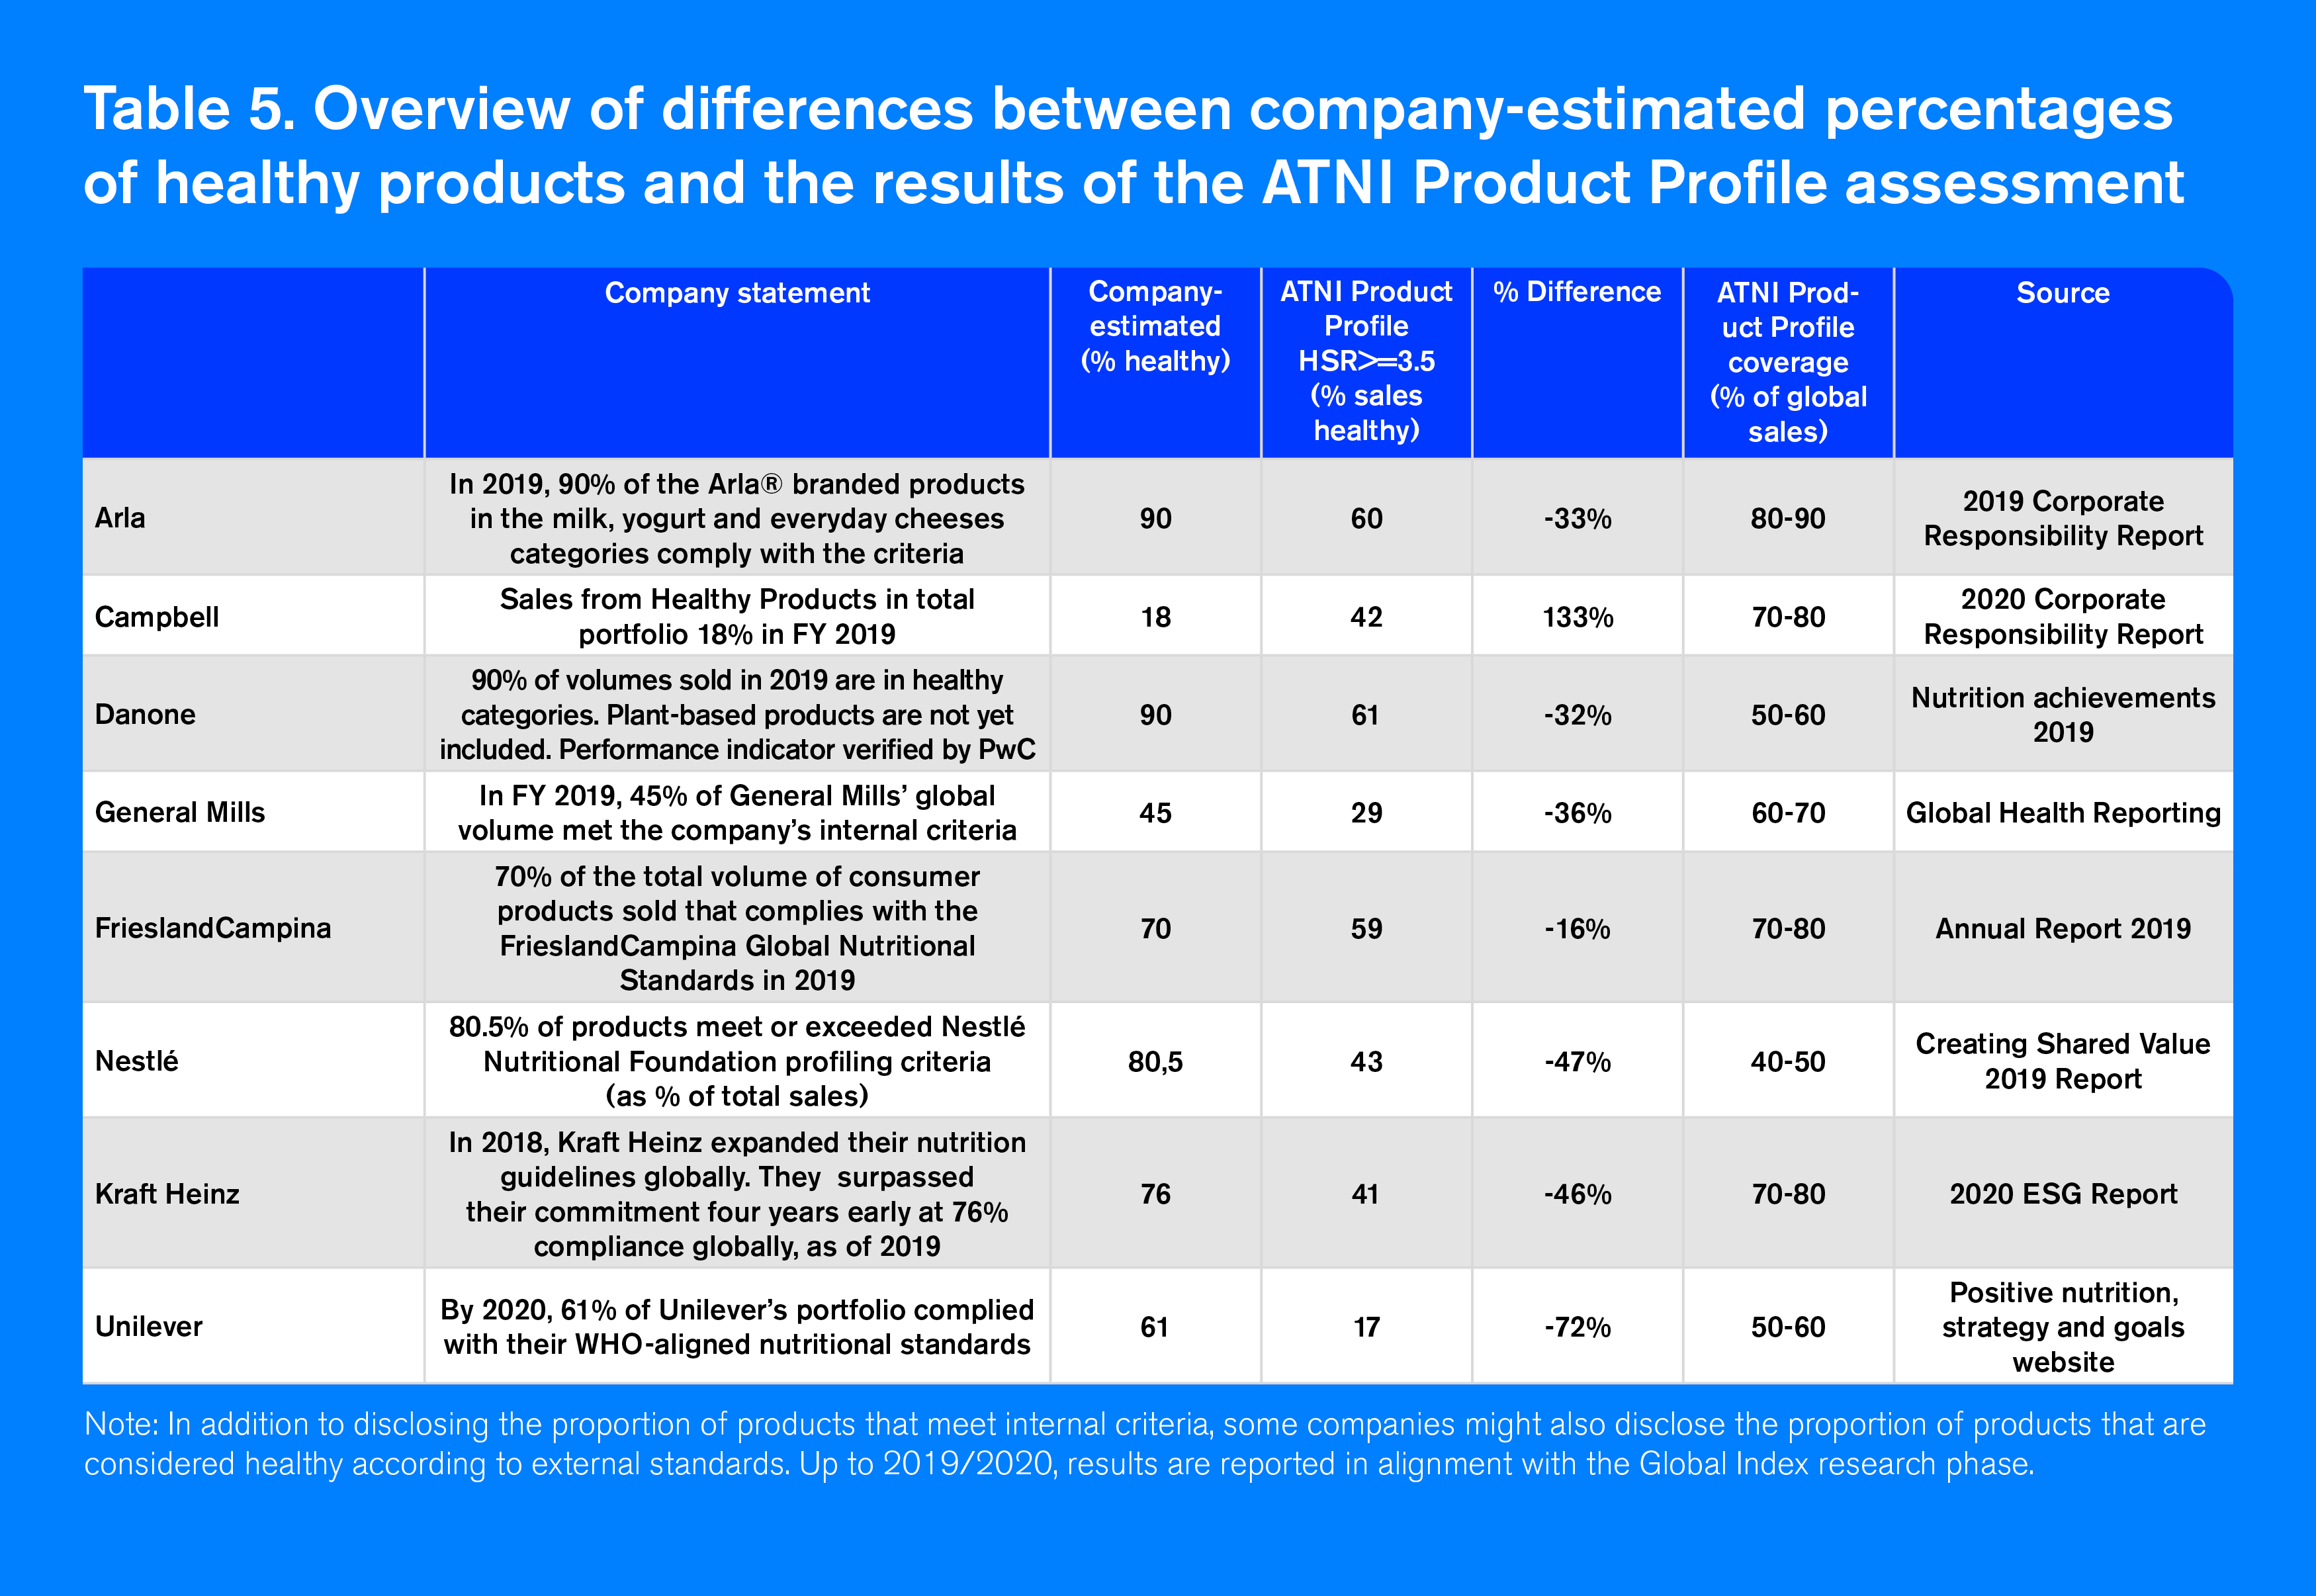
Table 5 (in Annex) shows there are significant gaps between ATNI’s Product Profile estimates on companies’ proportion of healthy sales and those reported by companies. The information presented in table 5, however, must be interpreted carefully. For example, ATNI relies on retail sales values, while some companies report sales by volumes. Discrepancies might also occur because of differences in product category definitions. Danone’s calculations, for example, exclude plant-based products, and for Unilever, ATNI’s Product Profile excludes foods like plain coffee and tea, which are significant sources of revenue for the company.
See Table 5 in AnnexThe only company that reports a lower percentage of healthy products than in ATNI’s Product Profile is Campbell. This might be because of the strict company definition of healthy ( products must “meet regional definitions for healthy, which include strict limits for total fat, saturated fat, cholesterol and sodium, AND have a requirement for a good source of at least one beneficial nutrient.”) compared to ATNI’s Products Profile healthy threshold (HSR>=3.5).
Product formulation and reformulation should be driven by specific and transparent definitions of which products are considered to meet ‘healthy’ thresholds or nutrition criteria, ideally described by companies’ NPMs (see Criterion B2).
Since the 2018 Index, Ajinomoto, BRF and Kraft Heinz, have defined a target for at least one nutrient. Kraft Heinz shows major progress with its newly-adopted NPM ‘Global Nutrition Guidelines’, defining nutrient targets by product category, with upper limits for nutrients of concern (i.e., calories, sodium and saturated fat). In 2020, the company set a new goal to achieve 85% compliance with its targets by 2025.
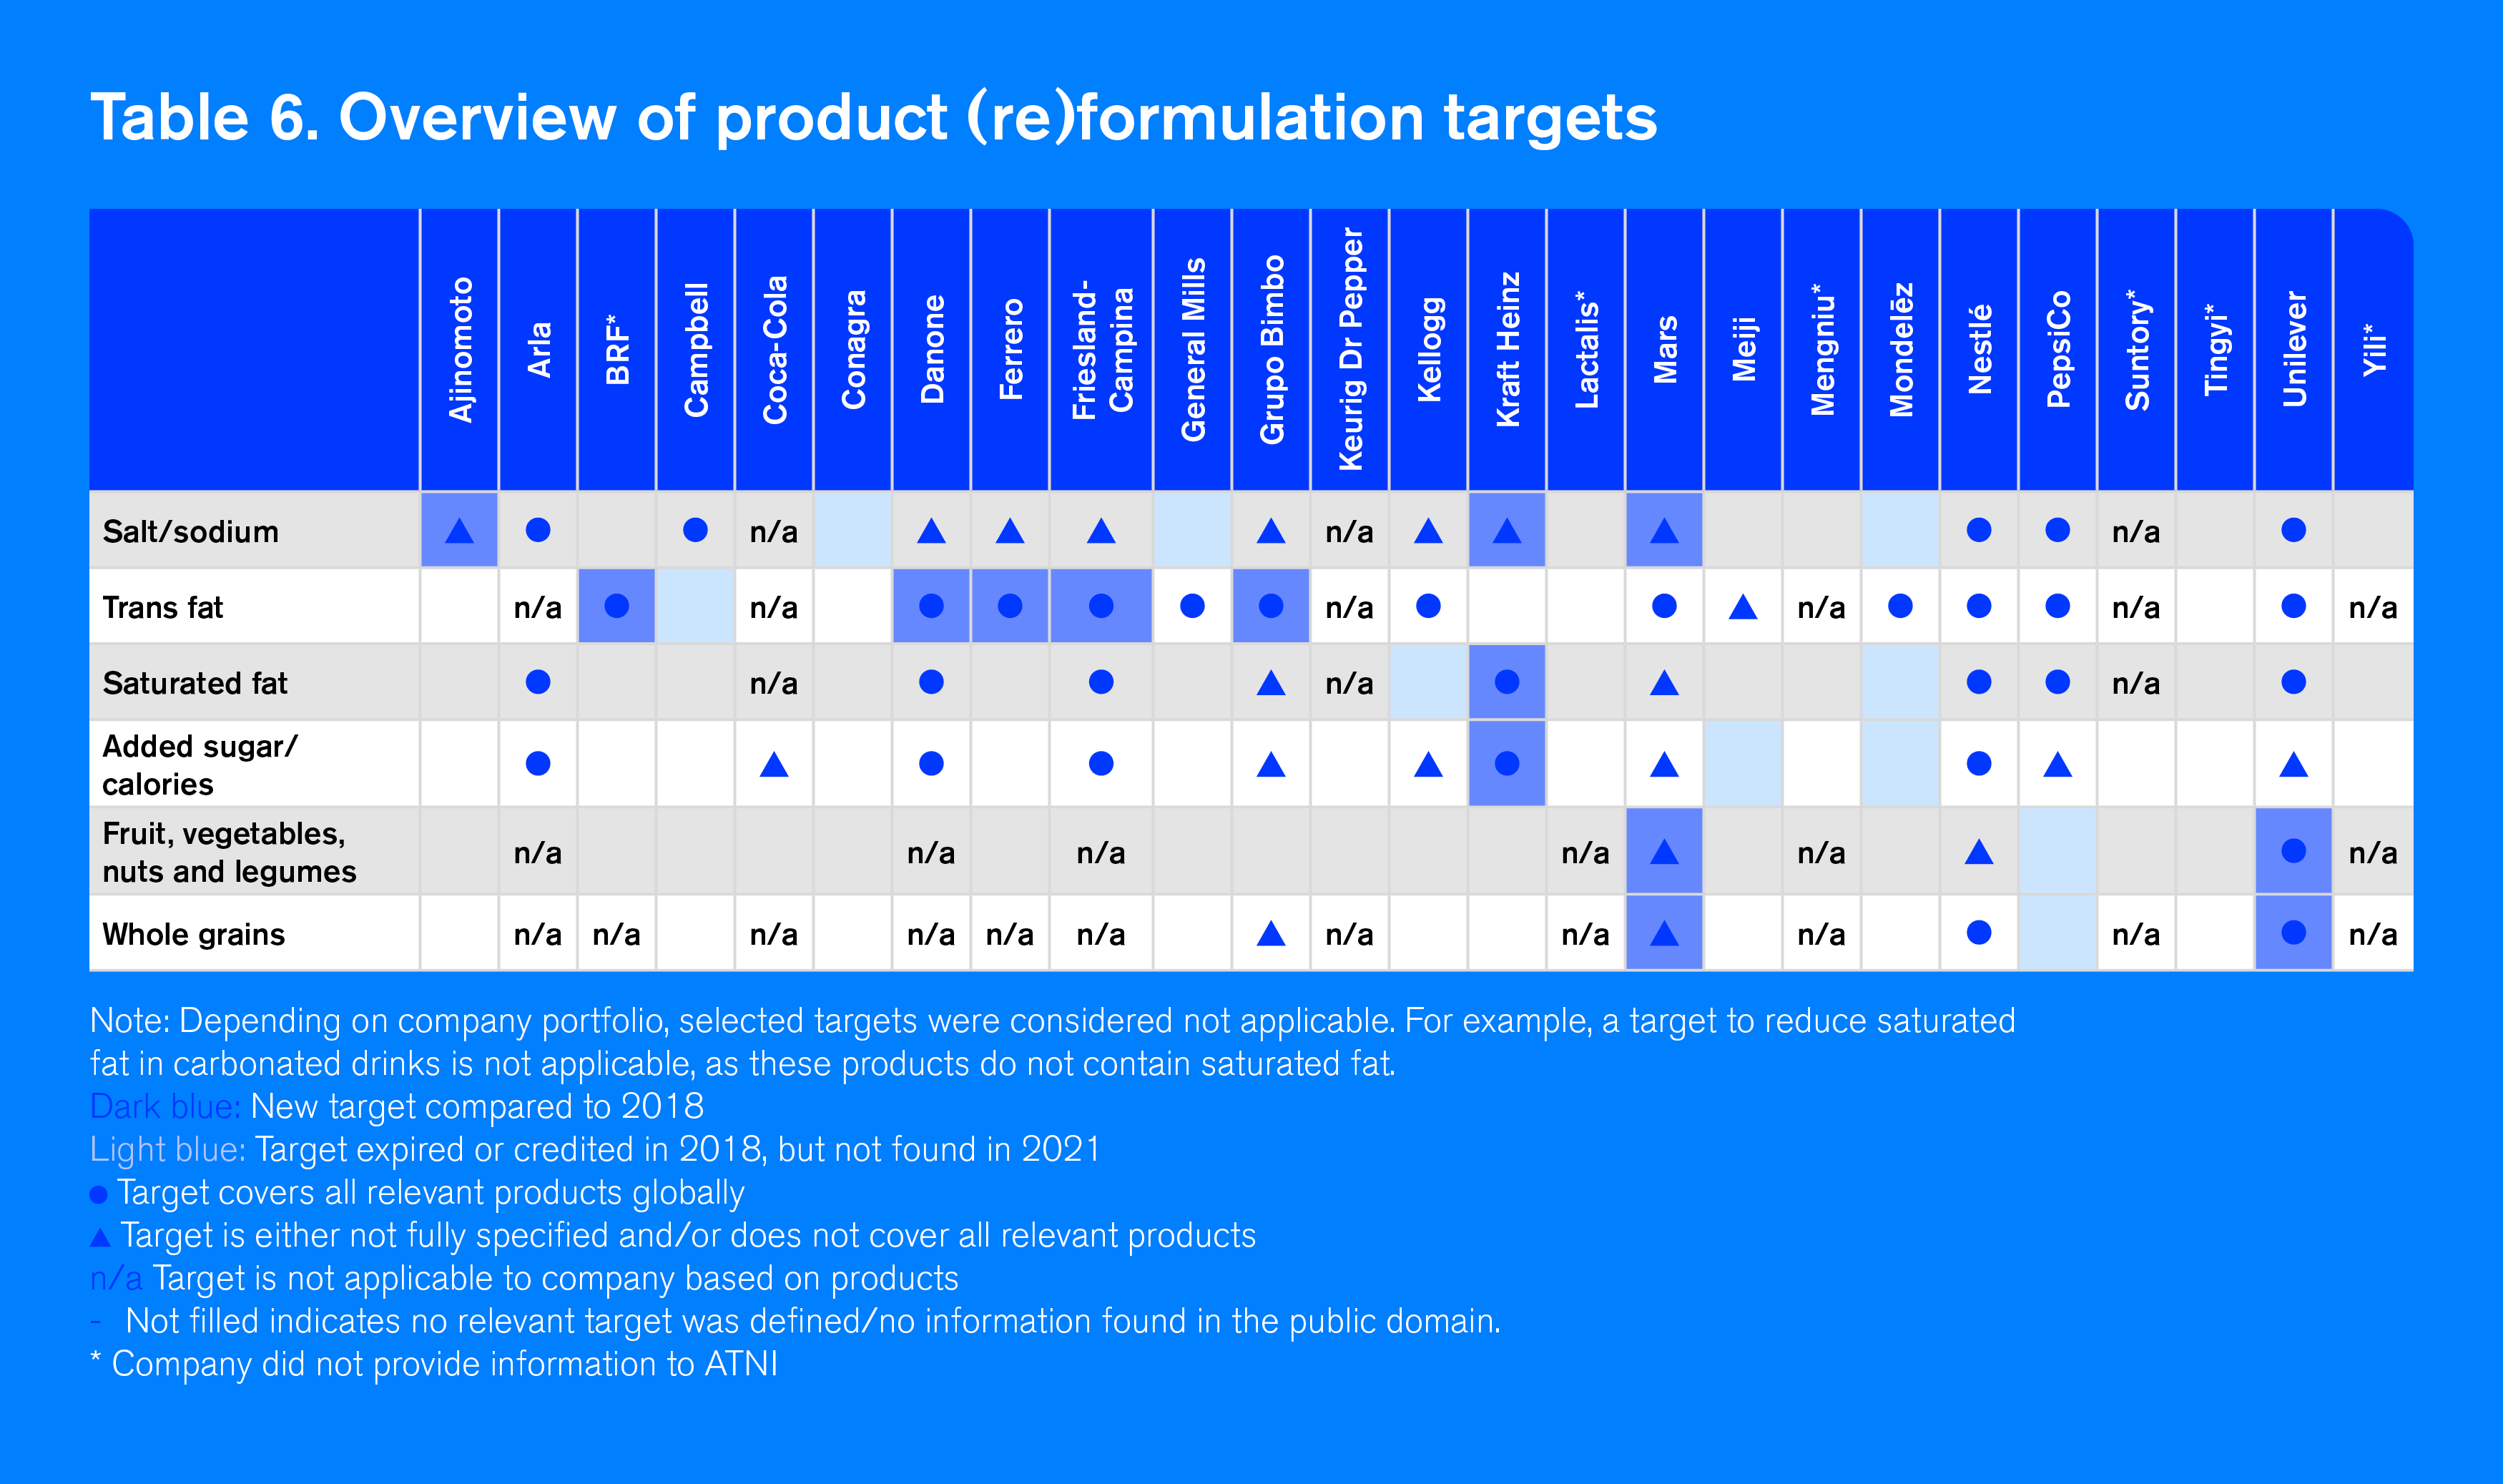
Companies’ commitments to (re)formulate products according to well-defined nutritional targets were extensively assessed, and an overview is shown in Table 6 (see below). Most companies (19) define one or more targets to (re)formulate their products. Of the 53 targets identified, 32 covered all products across relevant categories, globally. Overall, Nestlé, Unilever, FrieslandCampina, Danone, and Arla achieve the highest scores on (re)formulation targets across a range of relevant product categories.
Sodium and trans fat are the nutrients for which most defined targets. The 11 International Food and Beverage Alliance (IFBA) member companies in the Index are credited for the same trans fat target, given their commitment towards WHO’s 2023 goal to eliminate trans-fat from food supply.
Arla, Danone, FrieslandCampina, Mars, Nestlé, and Unilever have set at least one target for all relevant nutrients globally. Grupo Bimbo, Mars, Nestlé, and Unilever are the only companies that define a target for whole grains, and only Mars, Nestlé and Unilever do so for fruits, vegetables, nuts, and legumes (FVNL). Unilever shows industry best-practice by defining targets for positive nutrients (see Best Practices above).
ATNI encourages companies to define (re)formulation commitments according to these principles:
- Commitments should relate to absolute nutrient levels based on a weight, volume, or calorie basis. In the case of relative targets to increase or decrease nutrients compared to a baseline date, a full specification of baseline nutritional values is needed to ensure progress can be tracked without the need for historic product data.
- The time frame of achieving the target should be fully defined and the commitment should be SMART.
- The description of the products to which the commitment applies should be clear-cut and independent from company-internal information or definitions.
It is important to highlight that, overall, few companies had externally verifiable targets. This is because companies often define targets for specific categories, and definitions are not disclosed, therefore potentially limiting analysis of compliance at the product level. Boxes 8 and 9 (below) show companies’ commitment across the nutrients of interest.
Companies have significant scope to improve their disclosure of compliance with specific targets. While nine companies have defined a saturated fat target, only four disclose the percentage of all relevant products (by number or volume) that met targets by FY 2019. Similarly, just four companies disclose the percentage of all relevant products that met sodium/salt targets.
Some companies show progress by defining new KPI’s and disclosing progress through annual reports. In its Sustainability Report, Goals & Progress 2019, PepsiCo reports that, in 2019, 61% of its products did not exceed 1.3 milligrams of sodium per calorie; an increase from 58% in 2018. Unilever states that, in 2020, 77% of its portfolio enabled intakes of 5g per day of salt; although the company has not defined an externally verifiable target.
Most companies have made substantial progress on eliminating or limiting trans fats over the last decade. Seven out of the 12 companies that have defined a trans fat target disclose the percentage of all relevant products (by number or volume) that met the target by FY 2019. In its Position on trans fat reduction, Unilever states that 100% of its portfolio by volume has not contained TFAs originating from PHVO since September 2012. Ferrero, in its Statement on Product Formulation and Innovation 2019, indicates it has “stopped using partially hydrogenated fats in its products since 2006, and confirmed the adoption of manufacturing processes which avoid the use of partially hydrogenated fats.”
Despite these examples, more specific and updated reporting in alignment with the WHO goal of eliminating trans fats, and recommendation to limit industrially-produced trans fats to two percent of oils and fats in all foods, is required.
Danone, Nestlé, and PepsiCo are transparent about progress in their added sugar/calorie targets. PepsiCo aims for 67% or more of its beverage portfolio to contain less than 100 calories from added sugars per 12oz serving by 2021. The company’s progress in FY 2019 was 47% up from 44% in 2018.
Nine companies provide evidence of investment in research or new technologies that enables the development or improvement of products aimed at addressing the specific needs of groups experiencing or at risk of malnutrition. Arla has established a public-private partnership in nutrition research – Arla Food for Health – to conduct studies of the health effects of dairy, dairy ingredients, and dairy’s role in healthy diets. Among others, the company’s ‘MAGNUS’ project examines how milk protein and whey permeate rescue linear and ponderal growth, as well as child development in moderate acute malnutrition. In Malawi, Ajinomoto has invested in research on the efficacy of ready-to-use therapeutic foods for children with severe acute malnutrition. ATNI also received evidence of a company doing studies focused on research to improve iron absorption to develop new products which can contribute to fighting micronutrient deficiencies in Africa and Asia.
Only FrieslandCampina and Nestlé publicly disclose a commentary on investments made in research or other business areas to develop products aimed at priority populations. FrieslandCampina initiated a nutrition survey among 18.000 children in South East Asia (SEANUTS), designed to provide insight into the nutritional status of children in Indonesia, Vietnam, Thailand, and Malaysia, and help the company develop appropriate products. Nestlé’s efforts to fight undernutrition/micronutrient deficiencies focus on fortification and biofortification. In Nigeria, the company is using biofortified maize (vitamin A) in cereal products and participating in workshops and forums on biofortified crops. arch or other business areas to develop products aimed at priority populations. FrieslandCampina initiated a nutrition survey among 18.000 children in South East Asia (SEANUTS), designed to provide insight into the nutritional status of children in Indonesia, Vietnam, Thailand, and Malaysia, and help the company develop appropriate products. Nestlé’s efforts to fight undernutrition/micronutrient deficiencies focus on fortification and biofortification. In Nigeria, the company is using biofortified maize (vitamin A) in cereal products and participating in workshops and forums on biofortified crops.
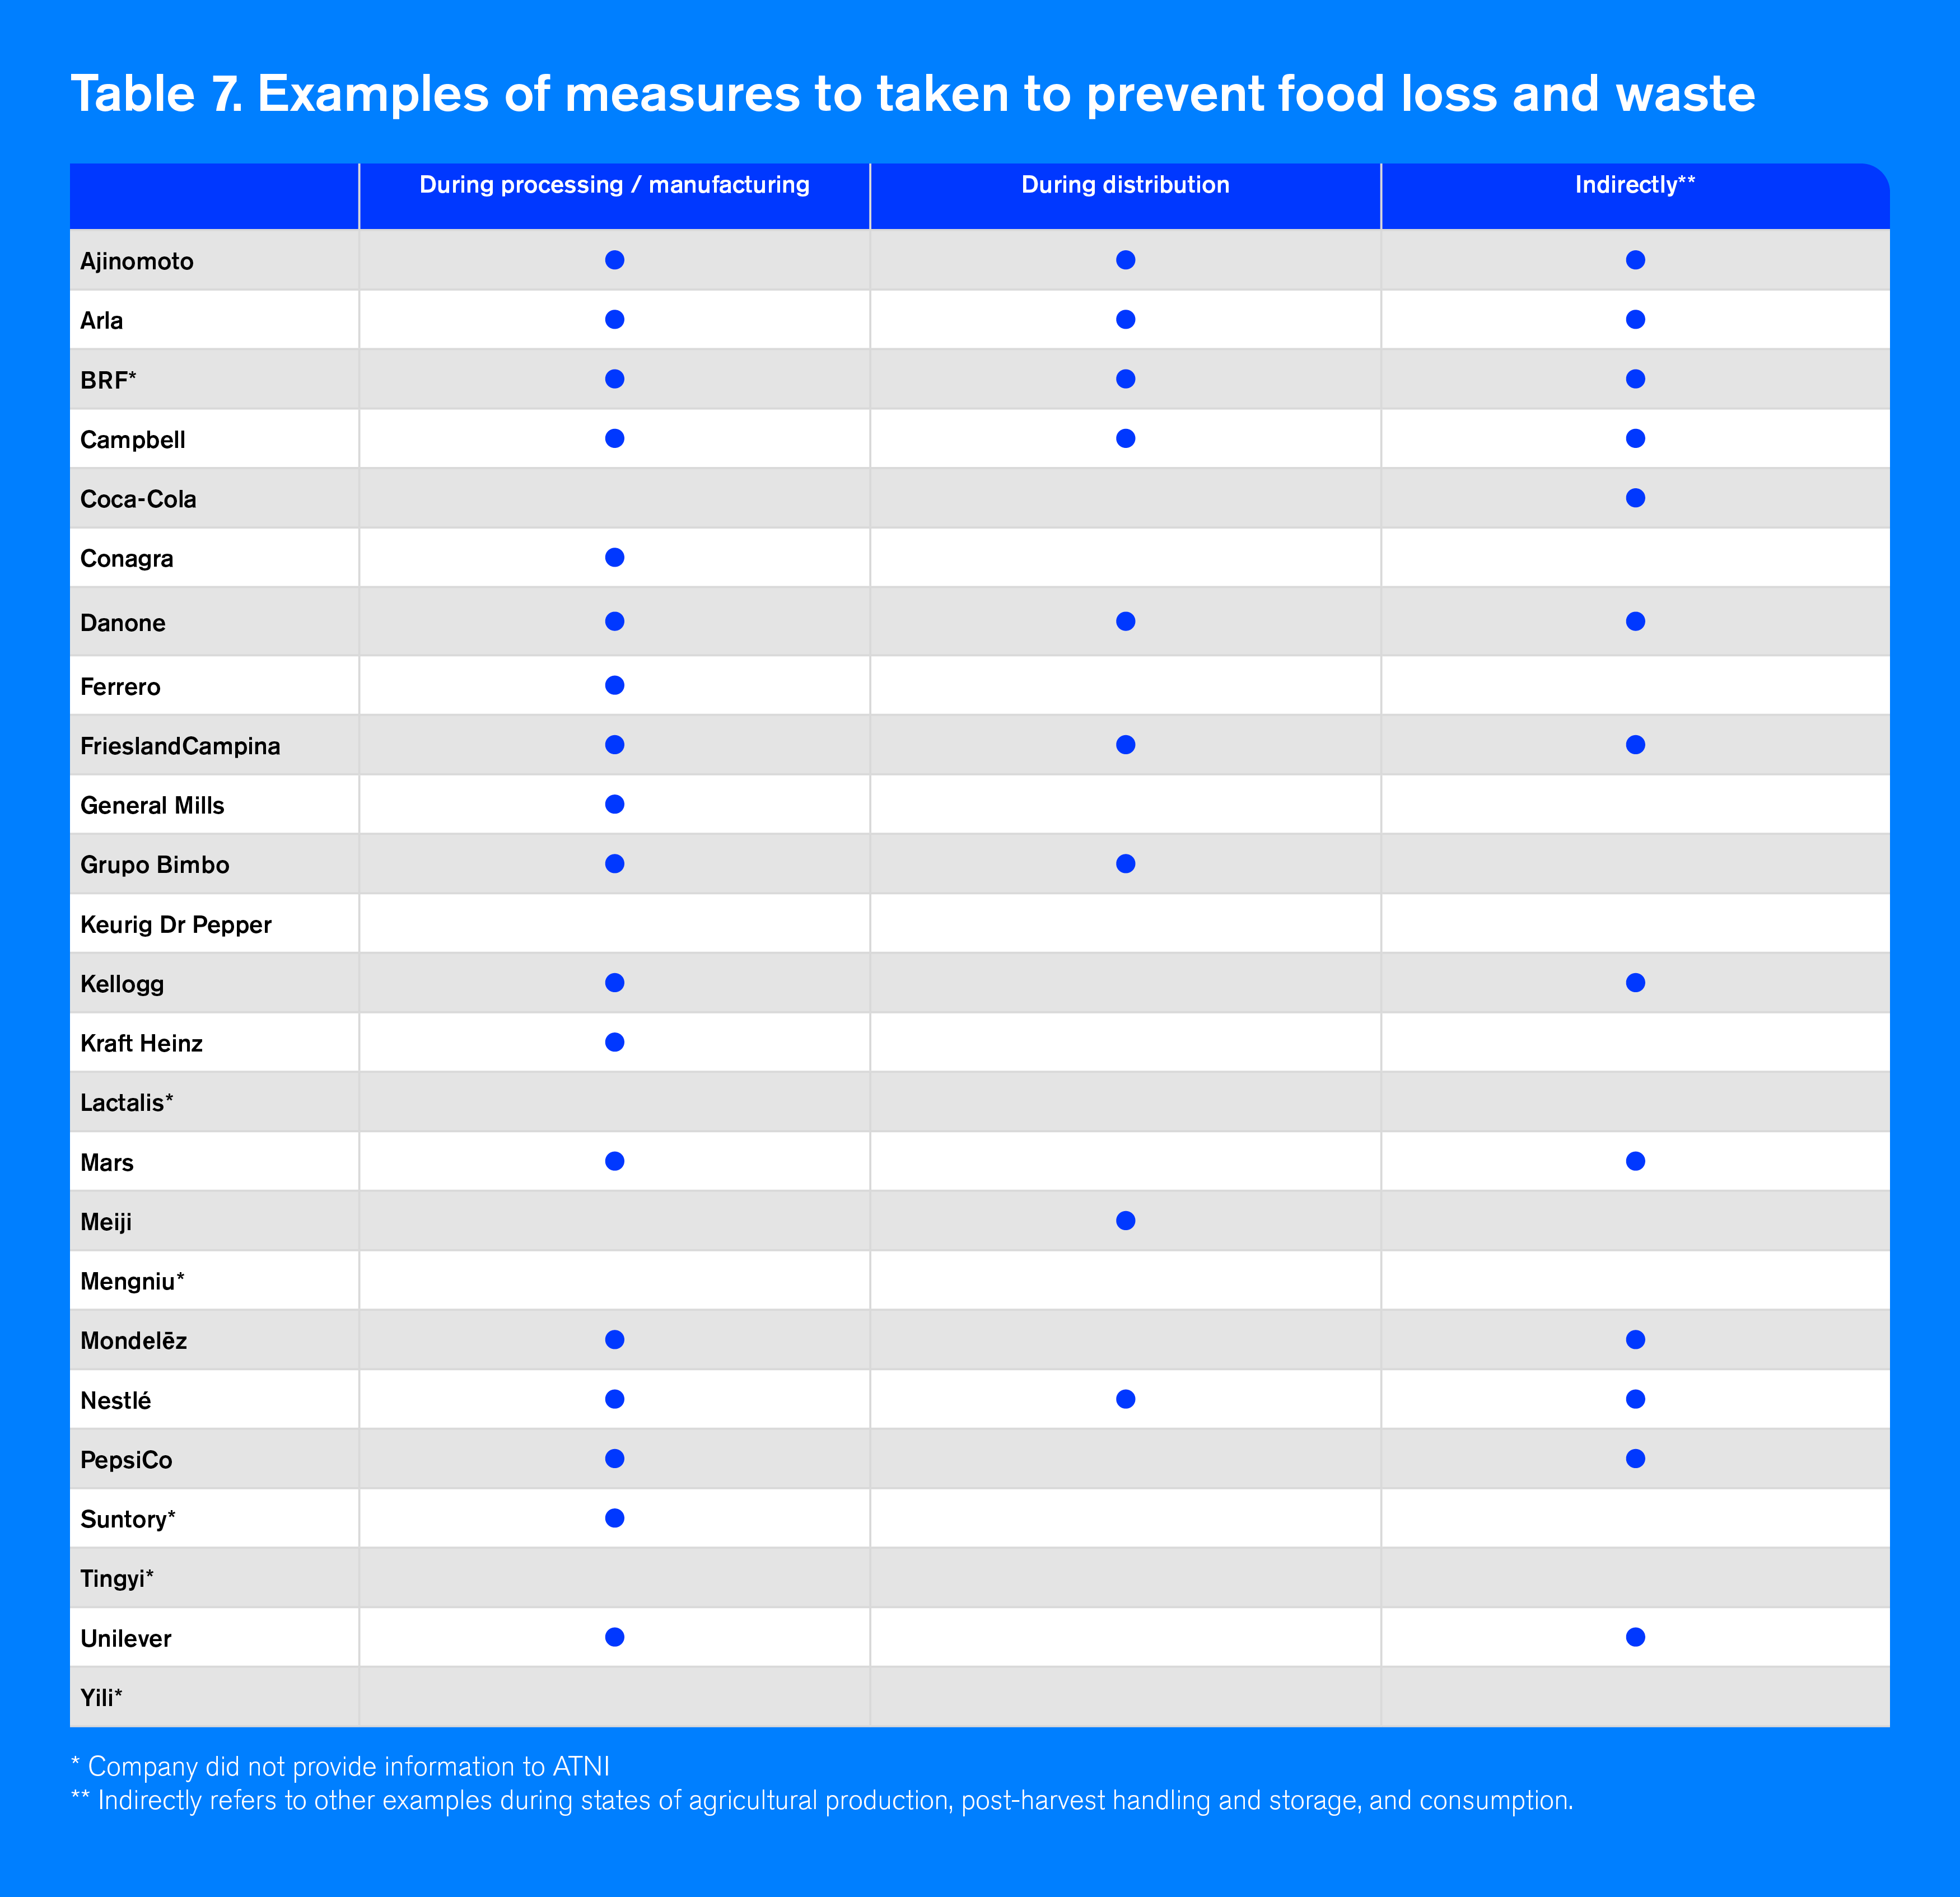
Food and beverage companies can prevent and reduce food loss and waste (FLW) in parts of the food chain where they have significant impact and influence. Most companies showed examples of measures to improve food supply chain efficiency and reduce FLW either during processing, distribution or indirectly in the post-harvest, storage or consumption stages (as shown in Table 7 in Annex).
Most companies (16 out of 25), provided examples of recent efforts to develop products with smaller packaging sizes or serving sizes, aimed to improve consumer portion control. While five companies showed evidence to ATNI on related research, Unilever and Mondelez were the only companies to provide research examples which include evidence of efficacy of portion control efforts on consumer behavior.
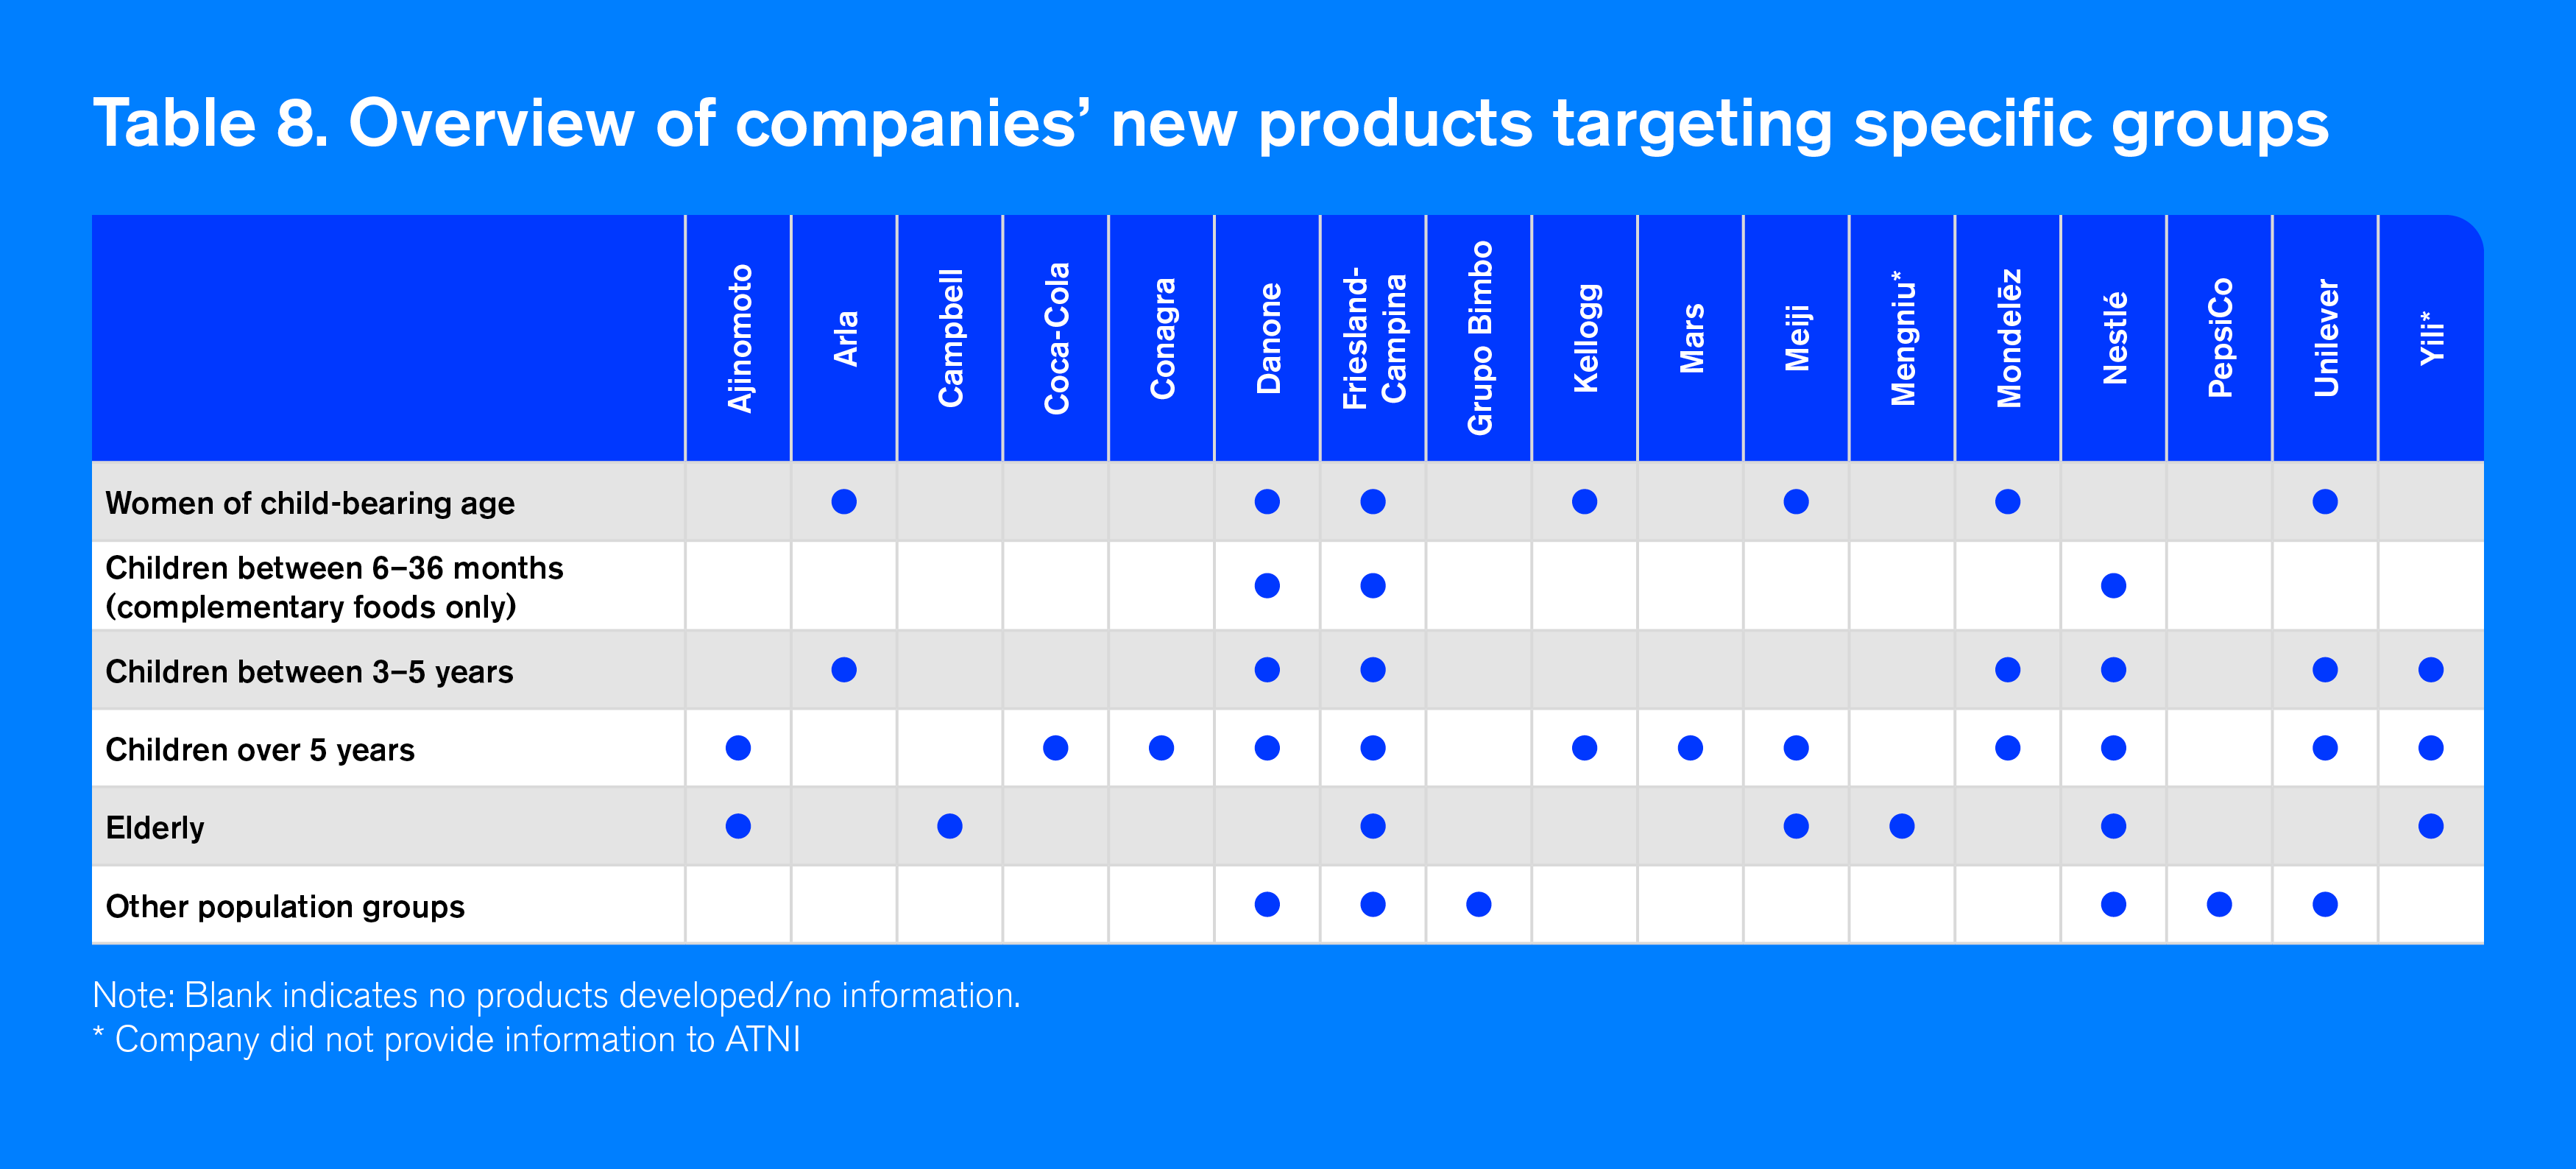
Seventeen companies report that they developed products targeting specific groups by in the last three years. An overview is shown in Table 8 (in Annex).
Twelve companies provide examples of developing specific products in the last three years, aimed at children over five years old, as part of an approach to addressing the needs of priority populations. ATNI found the most examples for this age group, followed by the elderly, children between three and five years old, and women of childbearing age. It is essential that companies adopt strict nutrient criteria for all products and market them responsibly.
See Table 8 in AnnexAlthough most companies have defined relevant nutrient (re)formulation targets, companies can do much more to improve accountability on their commitments by:
- Disclosing the percentage of product portfolio that meets ‘healthy’ criteria on an annual basis.
- Supporting government-defined SMART targets for reducing nutrients of concern. Ideally companies should cover all relevant product categories and report progress over time at portfolio-level (g., disclose the overall proportion of products with reduced sodium).
- Setting SMART targets to improve the proportion of positive nutrients and ingredients in their products.
- Conducting and disclosing research on the efficacy of portion control strategies to support healthy diets.
- Improve R&D investments in nutrition. Newly developed products should target specific groups as identified by relevant public health authorities.
- Publish commentaries on investments made in research or other business to address malnutrition. Transparency is important to improve quality and impact of research, and critical if companies want consumers and regulators to trust their products.
B3: Defining healthy and appropriate products
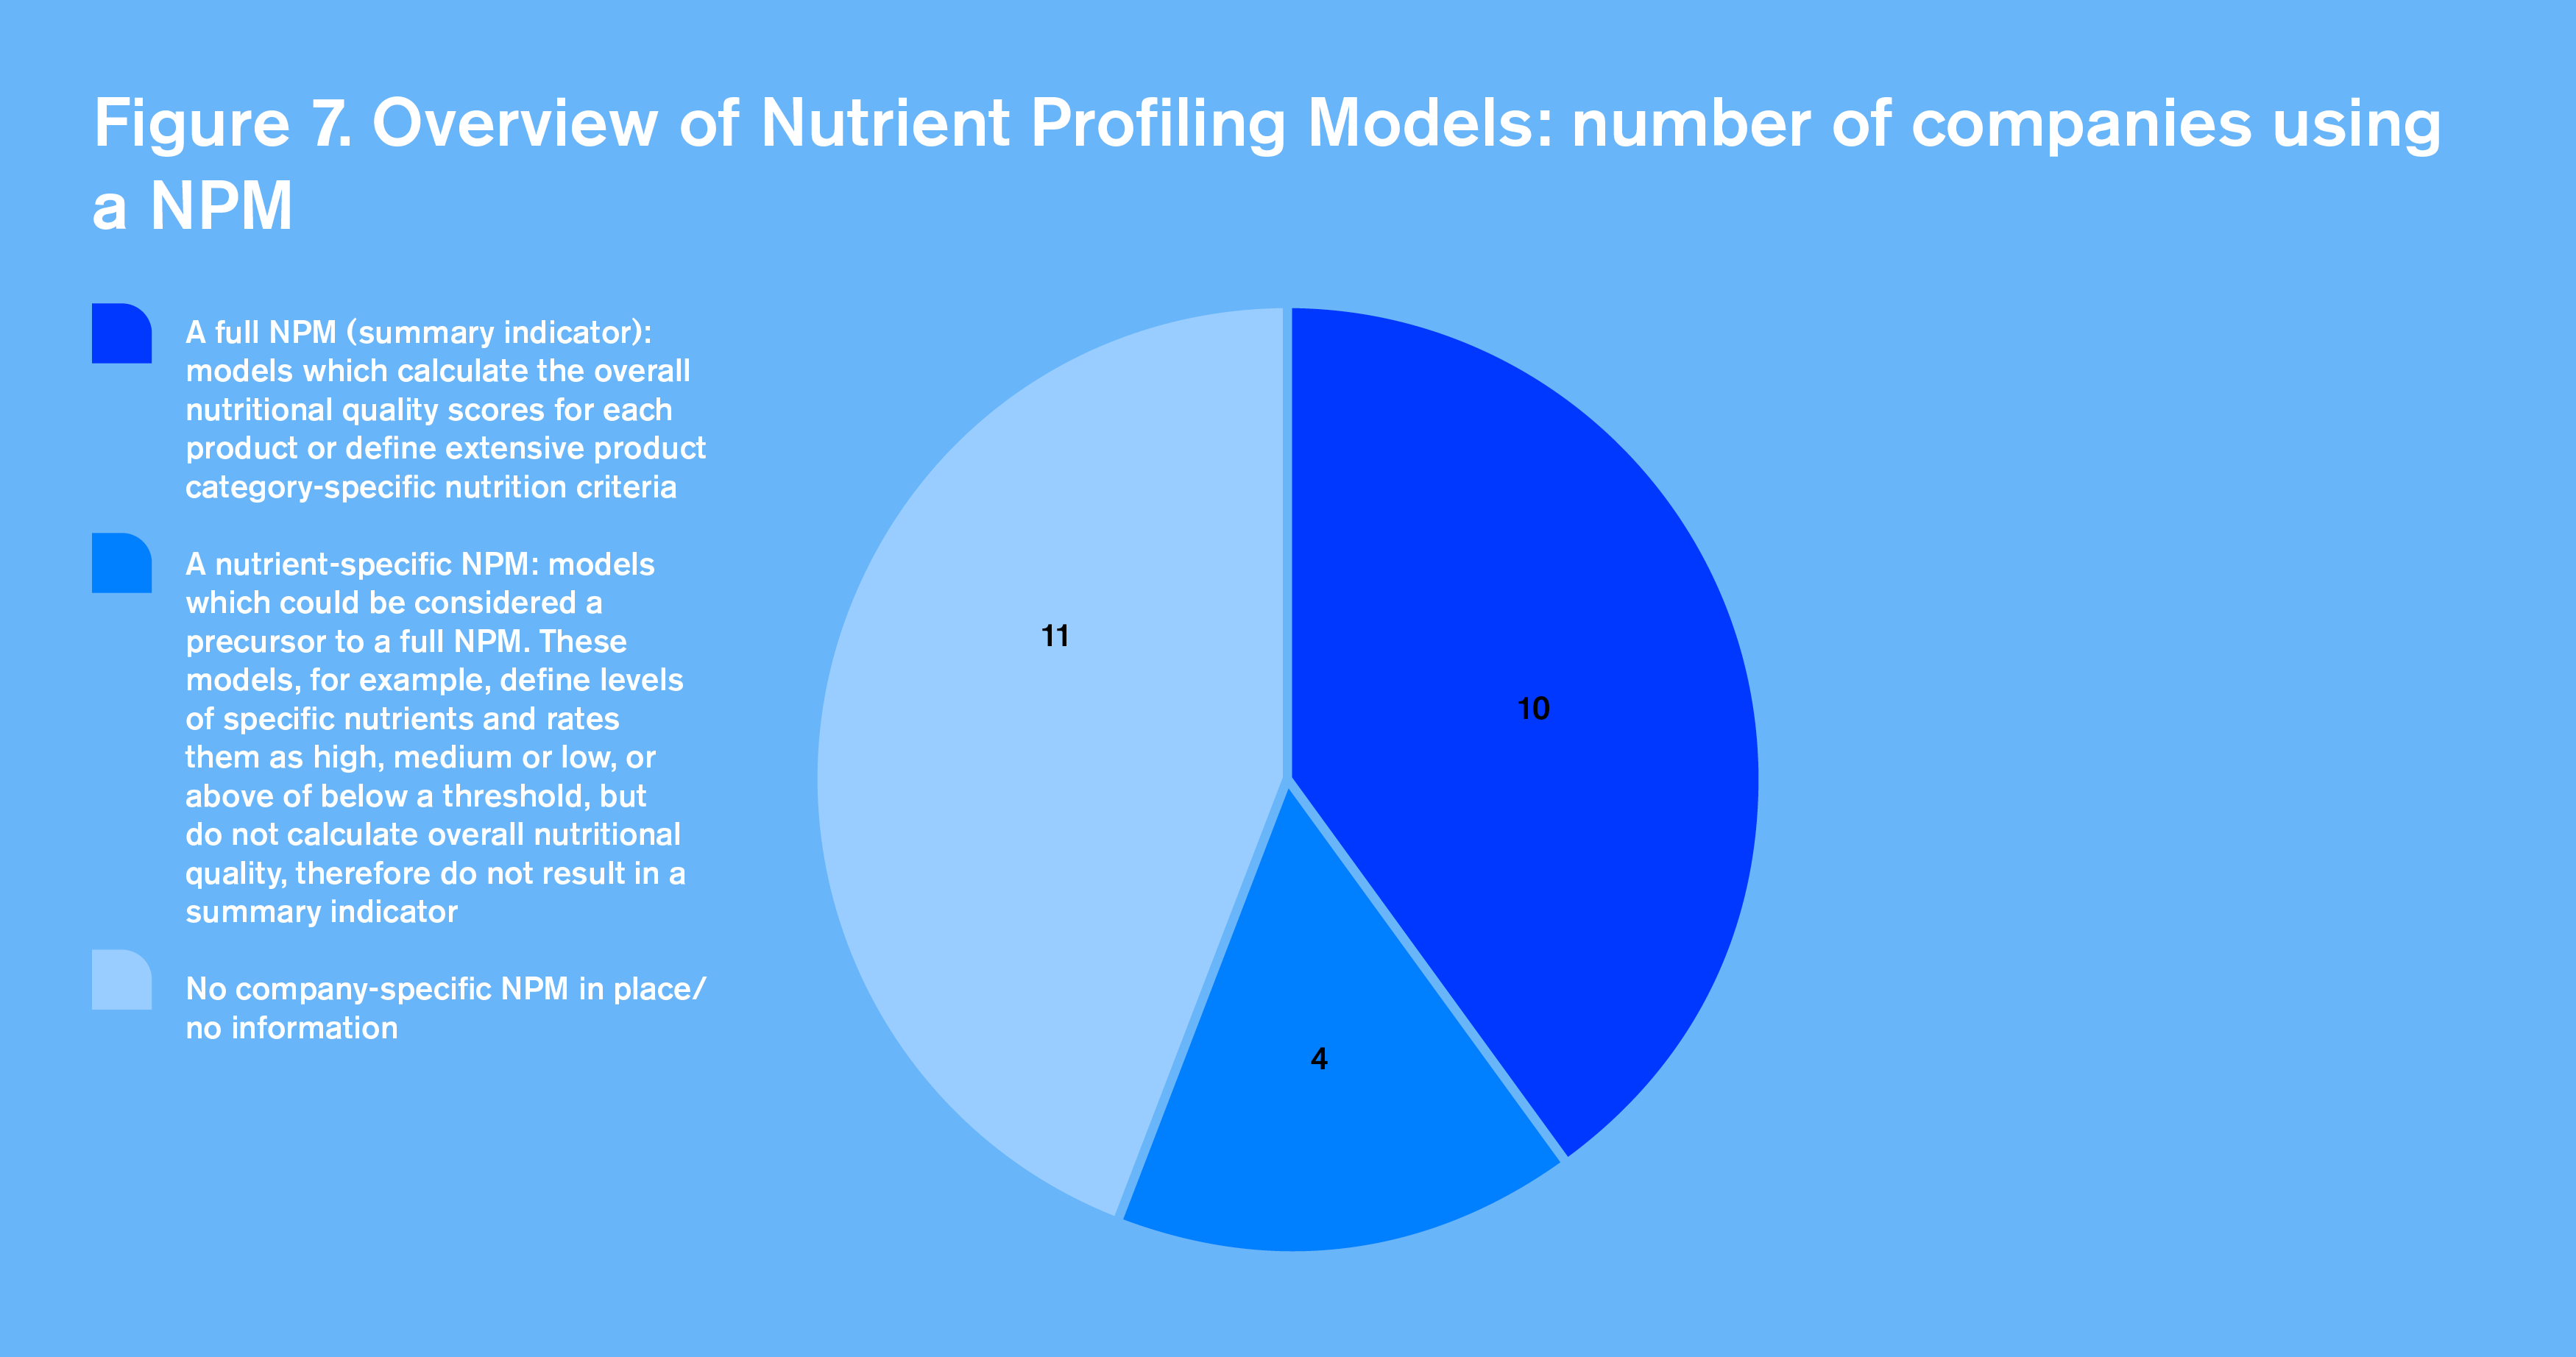
ATNI considers a full nutrient profiling model (NPM) those models which calculate the overall nutritional quality scores for each product or define extensive product category-specific nutrition criteria. ATNI also credits companies which use a nutrient-specific model, which could be considered a precursor to a full NPM. These models for example, define levels of specific nutrients and rates them as high, medium, or lor, or above or below a threshold, but do not calculate overall nutritional quality, therefore do not result in a summary indicator.
Fourteen companies are using some sort of NPM, compared to 13 in 2018. Since 2018, Kraft Heinz and Ajinomoto have adopted a new formal NPM, while in 2020, Kellogg adopted a full internal NPM (that calculates overall scores of the nutritional quality of its products including both positive and negative nutrients), and Grupo Bimbo published new guidelines adapted from a government-endorsed system. Unilever informed ATNI is in the process of updating its NPM, primarily adding thresholds for positive nutrients.
Companies that have not yet adopted a NPM should be transparent on their efforts to improve the nutritional quality of their products. It is important to note that some companies which have not adopted a company specific NPM, do make reference to using other existing criteria to define ‘healthy’ products (e.g. FDA definition of ‘healthy’).
More companies are utilizing independent NPMs to evaluate the nutritional quality of their products. FrieslandCampina, for example, aligns criteria for trans-fat, saturated fat, added sugar, and sodium from Choices International, which was developed by independent scientists. Kellogg has started using an independent government-endorsed NPM, the Nutri-score, as a tool to (re)formulate products, and Nestlé has begun using the HSR to evaluate the nutritional quality of its portfolio, and is in the process of evolving its NPM to reflect the HSR.
Eight out of the fourteen companies that apply some sort of NPM cover all products and product categories, indicating there is still significant scope to ensure companies improve their offerings throughout their entire portfolios.
ATNI encourages companies to only fortify foods in accordance with relevant guidance (Codex/FAO) and select products or categories with underlying nutritional quality (e.g., meeting objective criteria, in addition to avoiding misleading consumers with claims which can make fortified products appear healthier options — see section on Labeling, chapter F).
See Category FSix companies (Danone, FrieslandCampina, Mondelez, PepsiCo, Arla, and Kellogg) commit to only fortify products of high underlying nutritional quality or meeting certain nutrition criteria — two more than 2018.
Two companies make an explicit commitment to only fortify products meeting nutrition criteria in its NPM. However, this information is not available in the public domain.
Danone is the only company to make an explicit and publicly available commitment. In its 2017 ‘Policy On Micronutrient Fortification’, Danone includes the statement: “The product chosen for fortification must be of good underlying nutritional quality and compatible with a daily consumption. For this reason, only products belonging to Danone ‘healthy categories (as listed in Danone Nutritional Targets)’ are considered for fortification.”
Nine companies were found to have a formal statement indicating their approach to fortification of products aimed at addressing undernutrition is based on international guidance on fortification (i.e. Codex CAC/GL 9-1987 and WHO/FAO Guidelines on Food Fortification with Micronutrients). In 2018 only four companies assessed did so. Only three companies – PepsiCo, Nestlé and Mondelez – were found to publicly disclose this approach. Generally, ATNI did not find evidence of companies committing to also use these international standards for their fortification approaches when and where local regulations do not exist.
As demand for products that allegedly would have immunity benefits has increased during the COVID-19 crisis, the availability of accurate and evidence-based nutrition information for all packaged foods, including those that are fortified, is increasingly important. Companies must ensure that fortified products which do not meet nutrition standards, avoid carrying health claims (more on this can be found in Category F, on labelling).
See Category FMethodology: Healthy multiplier results
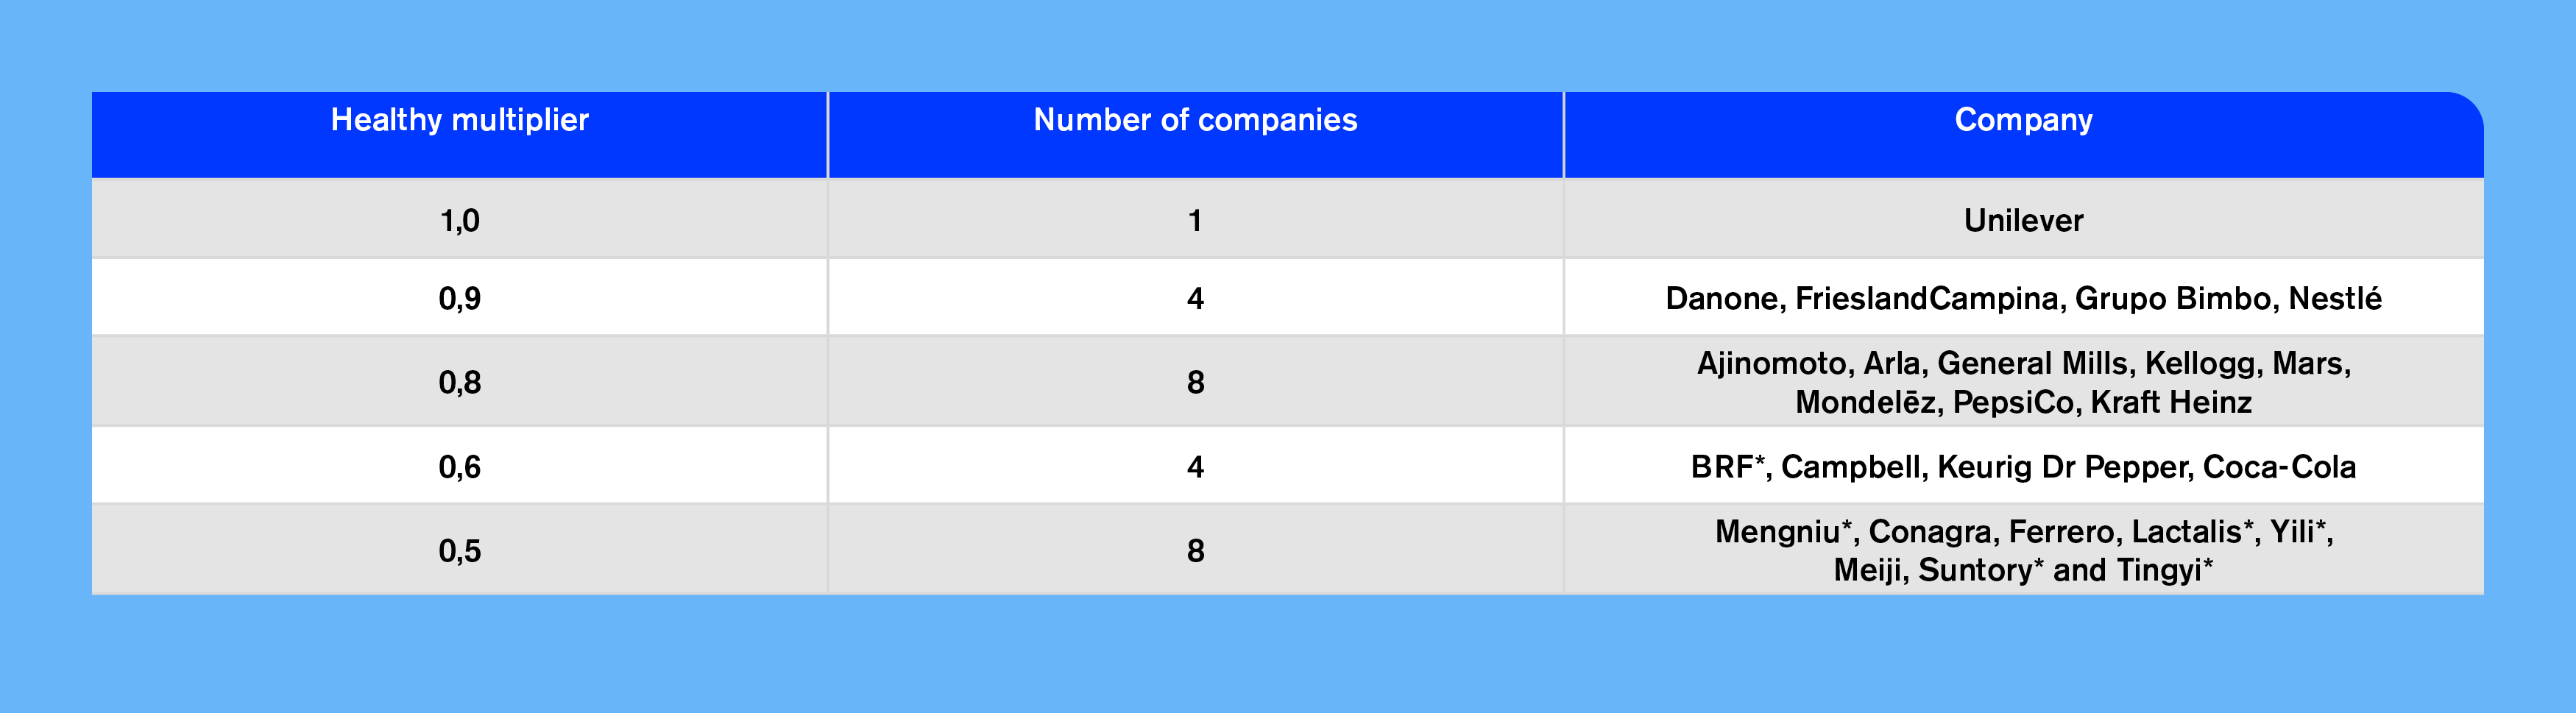
In the Global Index 2021 methodology, a healthy multiplier is applied to any scores for commitment or performance indicators relating to ‘healthy’ products. The multiplier is derived from the company’s score on ‘Category B3: Defining healthy and affordable products’, and ranges between 0.5 (adjusting the underlying score) and 1 (having no effect on the underlying score).
Unilever is the only company that achieves a score of 7.5 or more (out of 10) in criterion B3, and therefore the healthy multiplier is equal to 1. The table below shows that for other companies with less robust NPMs a healthy multiplier is applied impacting indicators in the methodology that refer to ‘healthy’ products.
To improve and accelerate efforts to market nutritious products that support healthy diets, leading food and beverage manufacturers are encouraged to:
- Adopt an NPM (preferably a government-endorsed model) and utilize it to define which products are considered healthy. The NPM should cover all relevant product categories and asses both positive and negative food components.
- Validate internal NPM-based definition of healthy products with external standards (HSR >=3.5 healthy threshold).
- Improve transparency on research and other investments used to develop products designed to help address malnutrition.
- Publish a fortification policy and commit to only fortifying products of high underlying nutritional quality (i.e. products that meet objective nutrition criteria, for example as in the company’s NPM). For fortification of foods and beverages, companies should align at minimum with relevant Codex Alimentarius standards (General Principles for the Addition of Essential Nutrients to Foods) and/or WHO/FAO (Guidelines on Food Fortification with Micronutrients) guidance.
Annex